This is a Doku for IT spend analysis sample with Power BI.
Source: https://docs.microsoft.com/en-us/power-bi/sample-it-spend from http://obvience.com/
The dataset: Click here
Before going further, we need understand the concept of the data model, please read the link below: https://en.wikipedia.org/wiki/Data_model
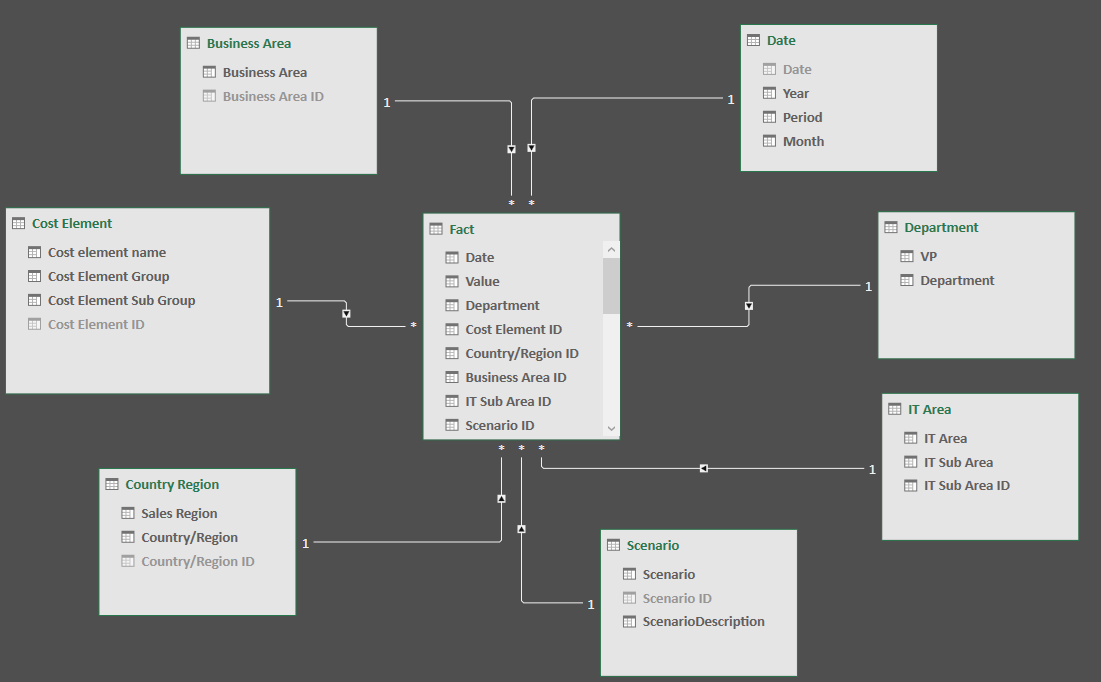
This analysis contains 8 entity (table) and every table has attribute.
- business area
- Attribute: Business Area, Business Area ID,
- cost element
- Attribute: Cost element name, Cost Element Group, Cost Element Sub Group, Cost Element ID
- country region
- Attribute: Sales Region, Country/Region, Country/Region ID
- date
- Attribute: Date, Year, Period, Month
- department
- Attribute: VP, Department
- it-area
- Attribute: IT Area, IT Sub Area, IT Sub Area ID
- scenario
- Attribute: Scenario, Scenario ID, ScenarioDescription
- fact_it
- Attribute: Date, Value, Department, Cost Element ID, Country/Region ID, Business Area ID, IT Sub Area ID, Scenario ID
Let's make the data model from the 8 entity. Just drag every Primary Key of the entity in power pivot or power bi data model
After that, create a measure in power bi or power pivot
Below are the measure of every graph,
Note! we use the format of table and attribut with DAX language
Extras: Quick Guide DAX
Drag this entity for every graph: . . .coming soon!