This is a Doku for opportunity analysis sample with Power BI.
Source: https://docs.microsoft.com/en-us/power-bi/sample-opportunity-analysis from http://obvience.com/
The dataset: Click here
Before going further, we need understand the concept of the data model, please read the link below: https://en.wikipedia.org/wiki/Data_model
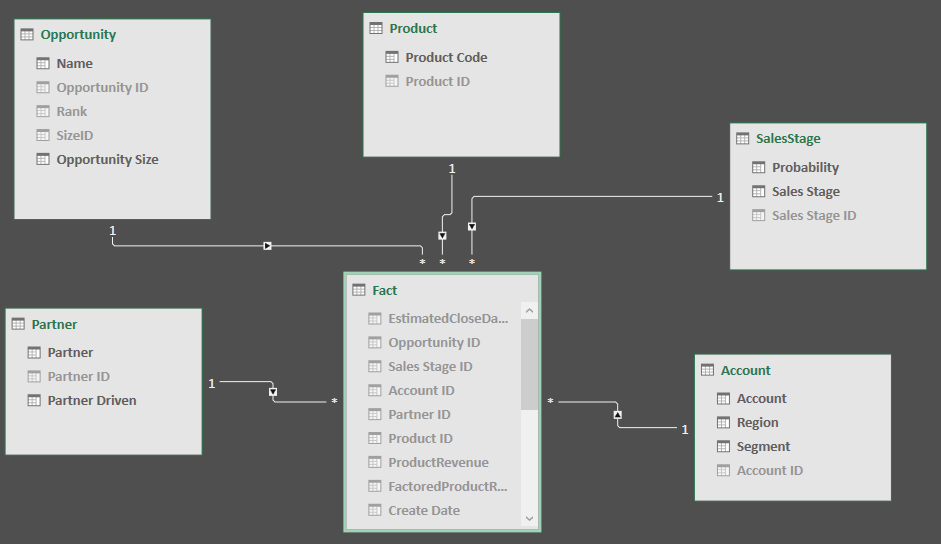
This analysis contains 5 entity (table) and every table has attribute.
- sales stage
- Attibute: Probability, Sales Stage, Sales Stage ID
- product
- Attibute: Product Code, Product ID
- partner
- Attibute: Partner, Partner ID, Partner Driven
- opportunity
- Attibute: Name, Opportunity ID, Rank, SizeID, Opportunity Size
- fact
- Attibute: EstimatedCloseDate, Opportunity ID, Sales Stage ID, Account ID, Partner ID, Product ID, ProductRevenue, FactoredProductRevenue, Create Date, Opportunity Days, Year, Month_Number, Month
Let's make the data model from the 8 entity. Just drag every Primary Key of the entity in power pivot or power bi data model
After that, create a measure in power bi or power pivot
Below are the measure of every graph,
Note! we use the format of table and attribut with DAX language
Extras: Quick Guide DAX
Drag this entity for every graph: . . .coming soon!