This directory contains Matlab scripts and functions for analyzing, simulating and optimizing multi-LED light source. Even though this simulator is orignially written for LED mixing, it is not limited to LED light sources.
Main executable script is tunableWhite.m. Several analysis functions and data matrices are also available for stand-alone usage, some of which are listed in this document.
Tunable white script is divided to four steps. First is the initialization of simulation parameters and light sources. After the initialization step optimal power coefficients for each LED as a function of color temperature are generated. The third step is the simulation of full color temperature range based on power coefficients generated on the second step. The last step outputs several plots for visual assesment of the simulation results. An example of visual assesment:
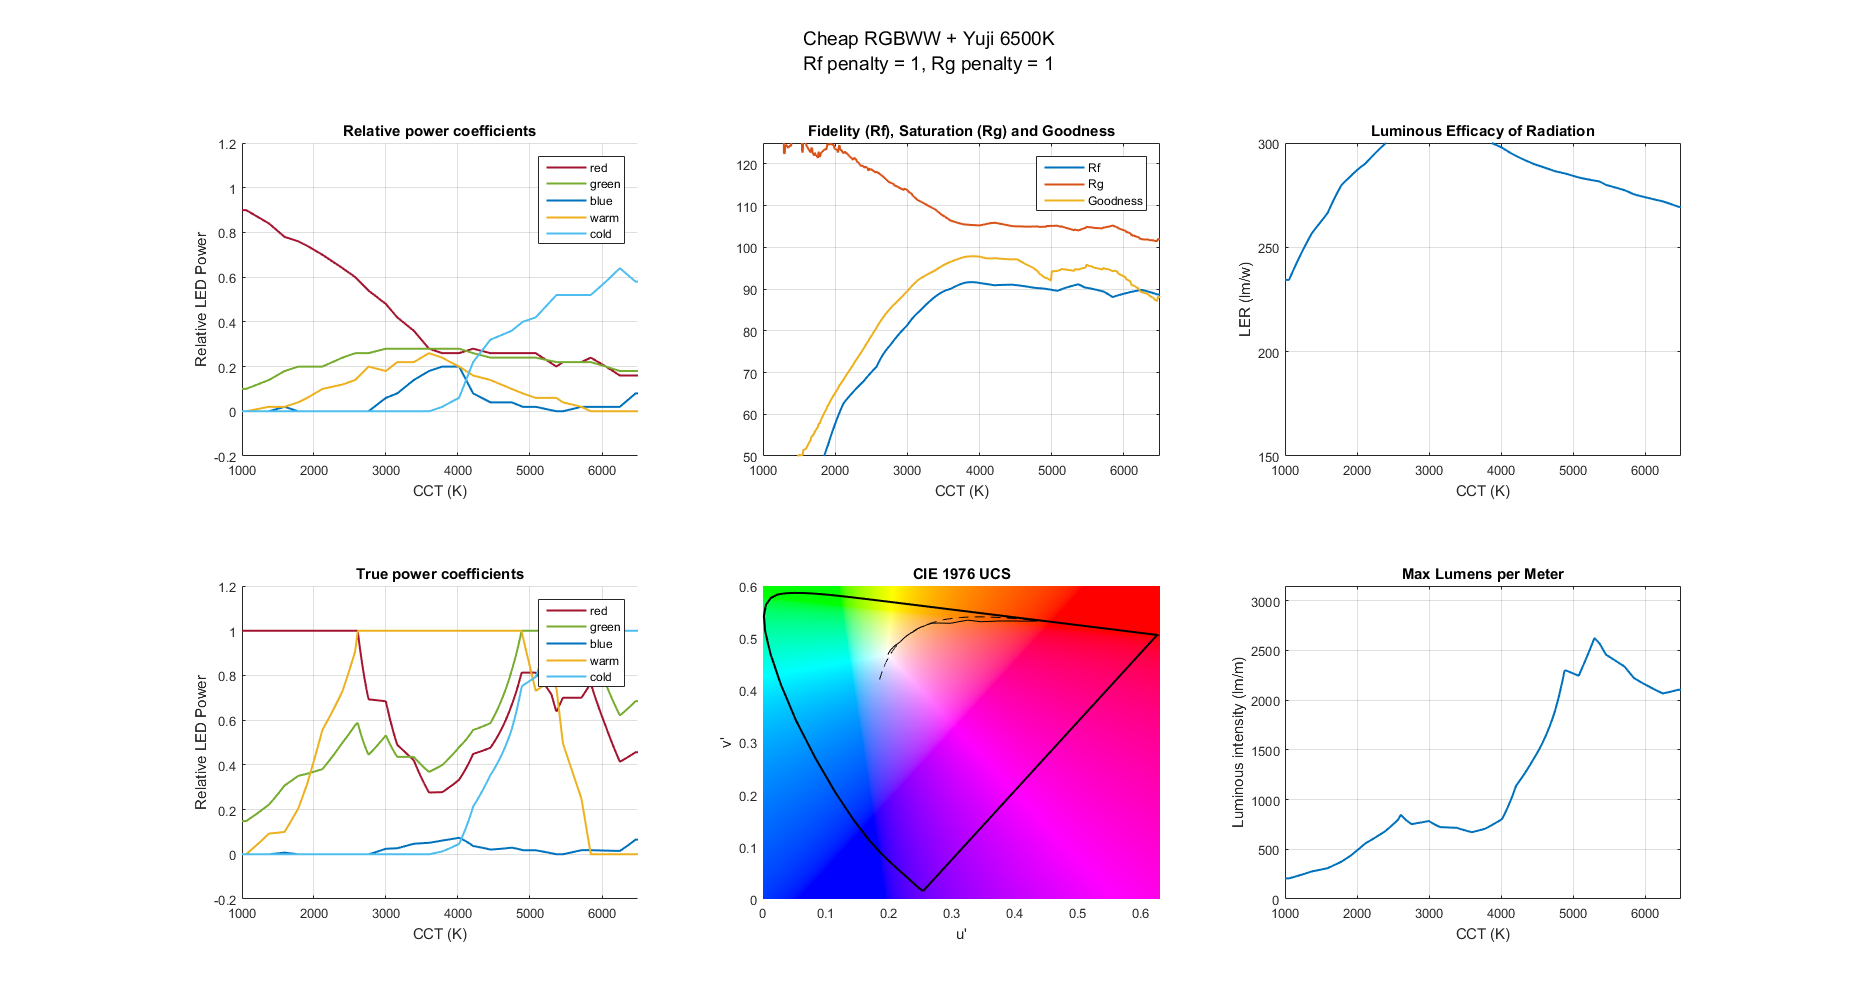 The left most plots are the power coefficients as a function of color temperature. Upper plot has coefficients normalized so that all coefficients sum up to unity. Lower plot has power coefficients for maximum luminous output taking LED luminous flux (lumens) into account.
The middle column contains two plots for assesment of the light quality. Upper plot has IES TM-30-15 fidelity score Rf and gamut score Rg with custom optimization variable "goodness" as a function of color temperature. Light goodness is based on fidelity score, gamut score and light whiteness. Plot below the TM-30-15 is CIE 1976 (CIELUV) chromacity diagram with all the simulation samples for color and whiteness assesment. The dashed line is Planckian locus, the colors of black body radiator at different temperatures.
On the right side we have luminous flux figures. Figure on top is the luminous efficacy of radiation which answers to question how many lumens does the light spectrum produce per watt of radiation power. Please note that this uses the power of radiation, not the electrical power fed into the LED. On the bottom are the maximum luminous fluxes as a function of color temperature. Title says "Max Lumens per Meter" since this simulator has been designed for LED strips for which the lumens are stated as lumens per meter.
Visualization step can also produce spectrum analyses for selected color temperature points for closer scrutiny. Example can be seen below in the Spectrum Inspecto section.
All spectrum data (SPDs, test color samples, observers and functions) are arrays sampled at 5nm intervals from 380nm to 780nm. 1st element in an array is value for 380nm, 2nd is value for 385nm and the last one is value for 780nm. All spectral data imported must be cropped and resampled to match this format.
cie.mat contains various lookup tables and functions for International Commission for Illumination (CIE) standards, these include:
- 2 degree observer
- 10 degree observer
- uv coordinates for Planckian locus in CIE1960 chromacity diagram from 1K to 25000K
- u'v' coordinates for Planckian locus in CIE1976 chromacity diagram (UCS) from 1K to 25000K
- CIE1976 chromacity diagram (UCS) as an matrix of sRGB colors. u' in range [0, 0.63], v' in range [0, 0.6]
- S0, S1 and S2 functions needed for Illuminant D calculation
- Precalculated SPDs for Illuminant D from 1K to 25000K
- SPDs for Illuminant F
- Reflectance distributions for 14 test color samples used in color rendering index calculation
- sRGB colors for CRI test color samples
- Spectral luminous efficiency function for photopic vision
- SPDs for black body radiators from 1K to 25000K
led_data.mat contains SPDs for various LEDs. Currently these LEDs are included:
- Cree A19
- Generic 3000K warm white LED
- Generic 6500K cold white LED
- Generic 17000K cold white LED
- Philips A19 (the original L-prize winner)
- Philips Hue @2700K
- Yuji BC2835L 2700K
- Yuji BC2835L 5600K
- Yuji BC2835L 6500K
- Yuji BC2835L 2700K
- Yuji BC5730L 2700K
- Yuji BC5730L 3200K
- Yuji BC5730L 5600K
- Yuji BC5730L 6500K
- Yuji VTC5730 2700K
- Yuji VTC5730 3200K
- Yuji VTC5730 5600K
inspectSpd.m contains tools for visual assesment and inspection of a SPD. Six graphs are included:
- Spectrum plot with reference SPD for spectrum similarity inspection
- CIELuv chromacity diagram plot with Planckian locus for light color inspection
- Hue plot based on TM-30-15 color icon for hue distortion inspection
- TM-30-15 Rf fidelity bar graph for 16 hue bins for fidelity inspection
- TM-30-15 color icon for saturation inspection
- Rg vs Rf diagram for preference inspection with a custom light goodness score

spdToCct.m calculates correlated color temperature for given SPD.
spdToCri.m calculates CIE color rendering index Ra and special color rendering indexes Ri for SPD.
Color rendering index is an largely outdated, but still the standing standard, quality metric for ligth sources. CIE does not recommend using color rendering index for evaluating color rendition of solid state light sources (LEDs).
spdToRfRg.m calculates TM-30-15 fidelity score Rf and gamut score Rg for SPD. Also average color coordinates and Rf values for hue bins are also returned. For more info see Development of IES method for evaluating the color rendition for light sources
IES TM-30-15 is the latest and greatest light analysis tool designed to address several problems of color rendering index.
spdToLER.m calculates luminous efficacy of radiation for SPD.
spdToXyz.m calculates CIE 1931 tristimulus values for SPD. Converters for color spaces from CIE 1931 values are also available. Go see the files, comments and source code.