This repo contains a Python script, main.py, that reproduces the quantitative results mentioned in:
Goffinet, J. (2018). Little Evidence for the Vocal Similarity Hypothesis. Proceedings of the National Academy of Sciences, 201804577. https://doi.org/10.1073/pnas.1804577115
See little_evidence.pdf for a pdf copy. The letter is a response to:
Bowling, D. L., Purves, D., & Gill, K. Z. (2017). Vocal similarity predicts the relative attraction of musical chords. Proceedings of the National Academy of Sciences, 201713206. https://doi.org/10.1073/pnas.1713206115
... and is itself responded to in:
Bowling, D. L., Purves, D., & Gill, K. Z. (2018). Reply to Goffinet: In consonance, old ideas die hard. Proceedings of the National Academy of Sciences, 201805570. https://doi.org/10.1073/pnas.1805570115
This repo also contains an implementation of the vocal similarity model described by Bowling et al. (2017).
See vocal_similarity.py.
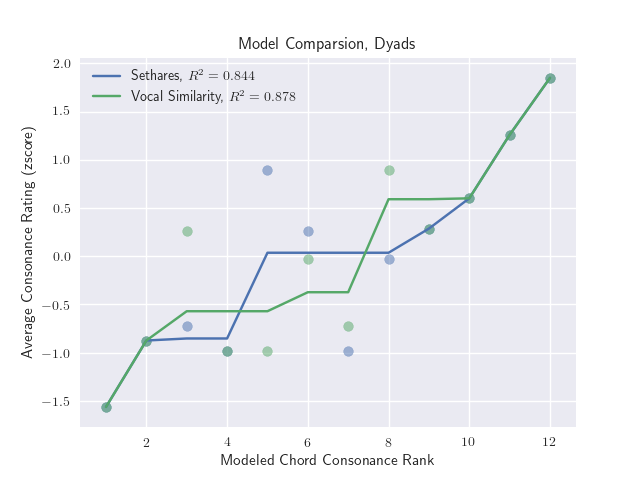
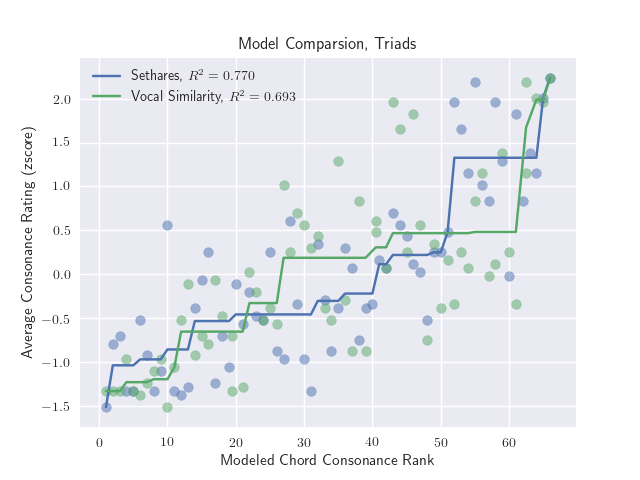
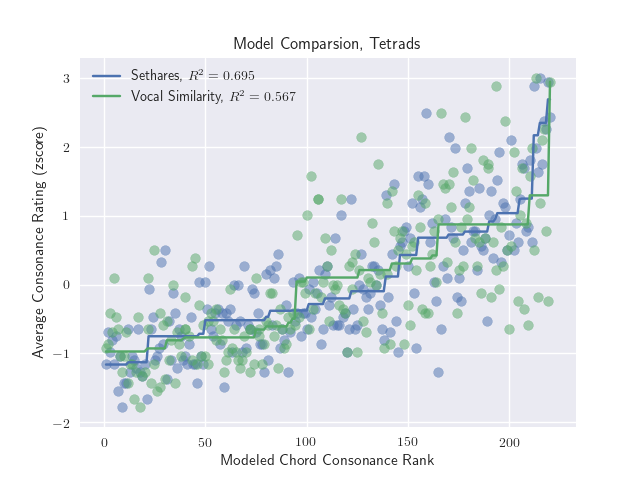
The plots below are output by main.py.
They compare the predictions of the vocal similiarity model and a roughness-based model introduced by William A. Sethares in:
Sethares, W. A. (1993). Local consonance and the relationship between timbre and scale. The Journal of the Acoustical Society of America, 94(3), 1218-1228.
... and updated in:
Sethares, W. A. (2005). Tuning, timbre, spectrum, scale. Springer Science & Business Media.
This model is based in part on the pure tone consonance parameterization reported by Reinier Plomp and Willem J.M. Levelt in:
Plomp, R., & Levelt, W. J. M. (1965). Tonal consonance and critical bandwidth. The Journal of the Acoustical Society of America, 38(4), 548-560.
An implementation of the Sethares disssonance measure is provided by GitHub user endolith, and is available here.
The trendlines in the plots below are isotonic regressions. Their R2 values give an upper bound on the variance in the experimental data attributable to the model.


