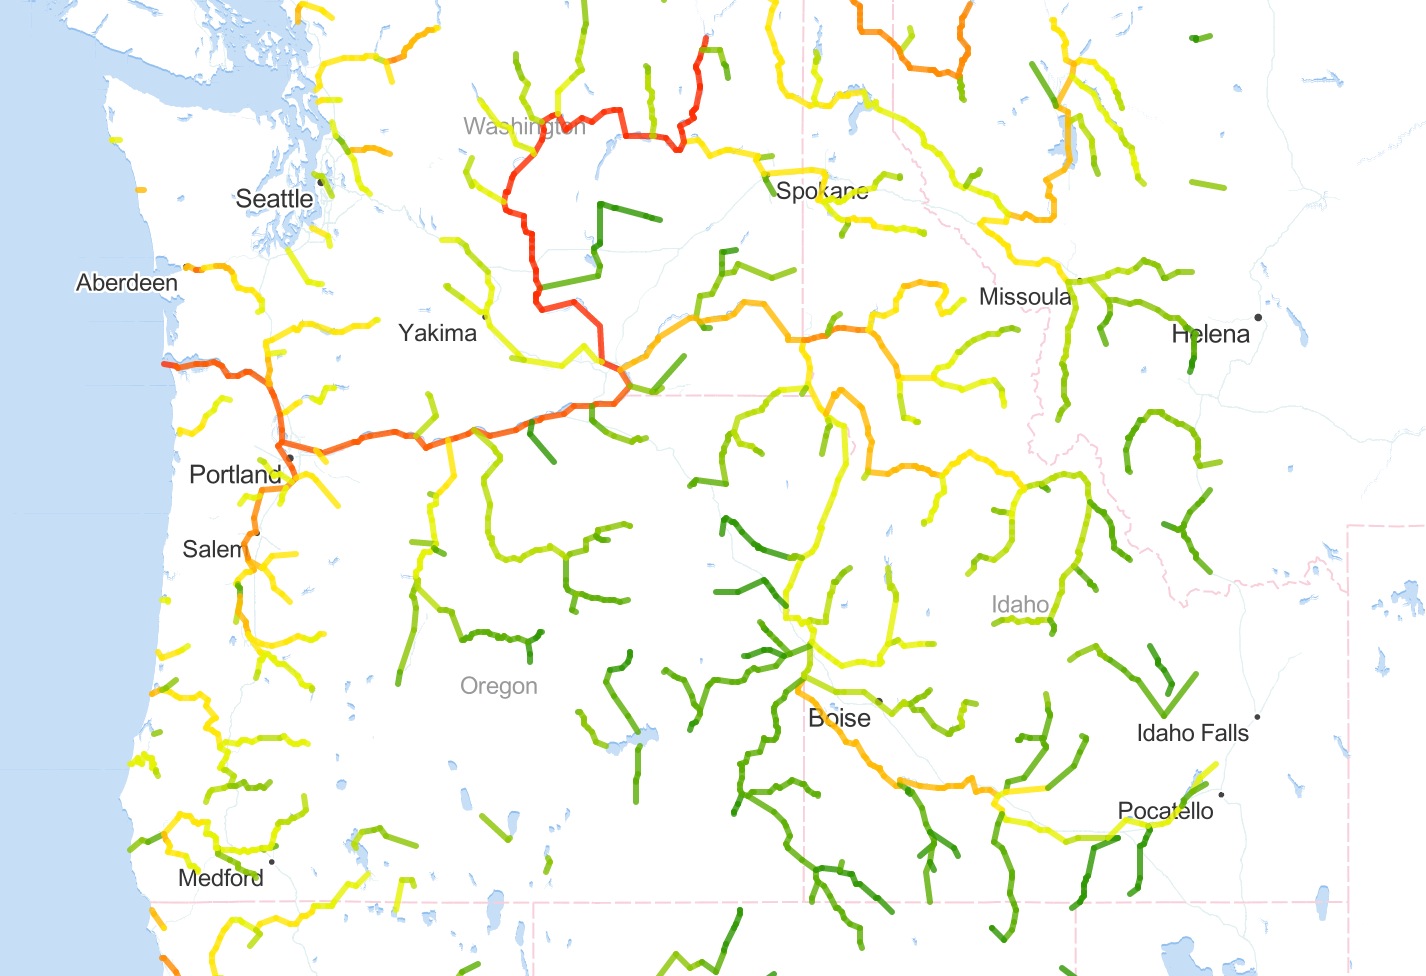
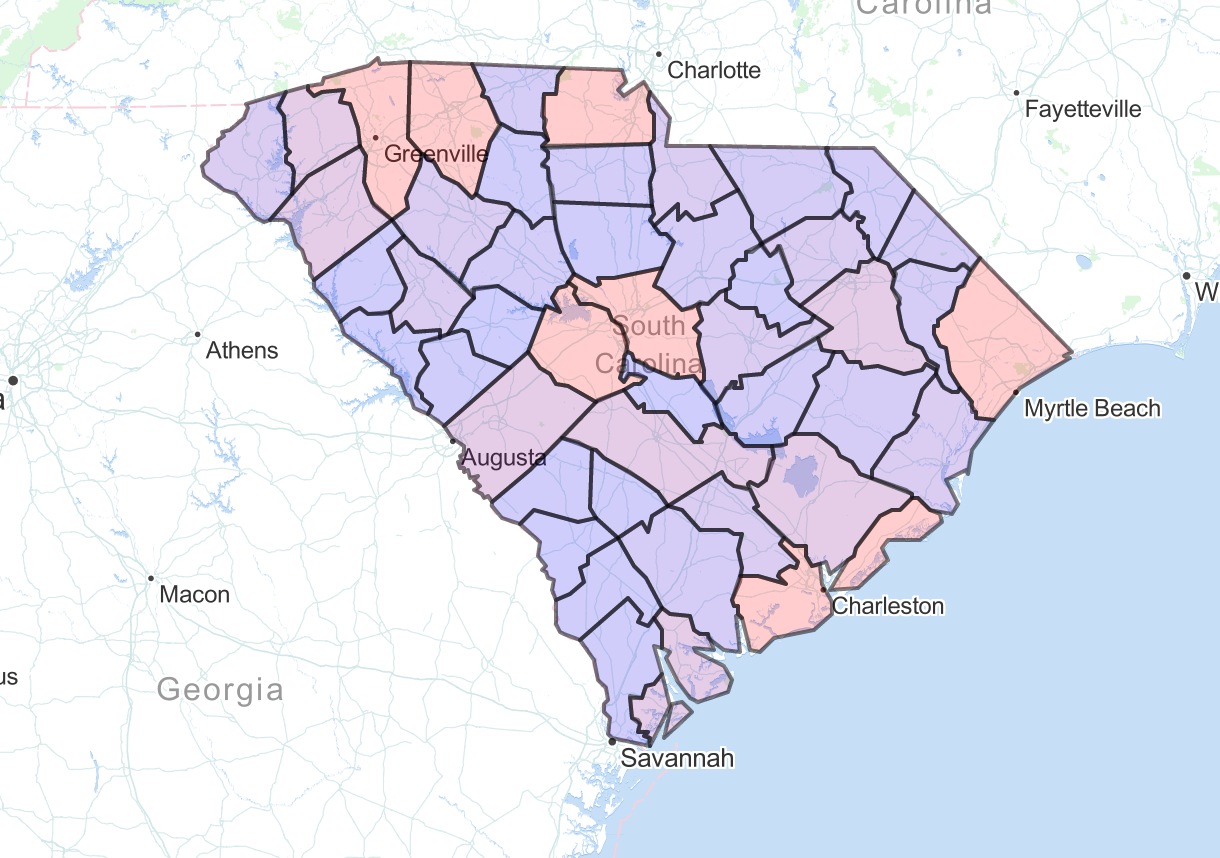
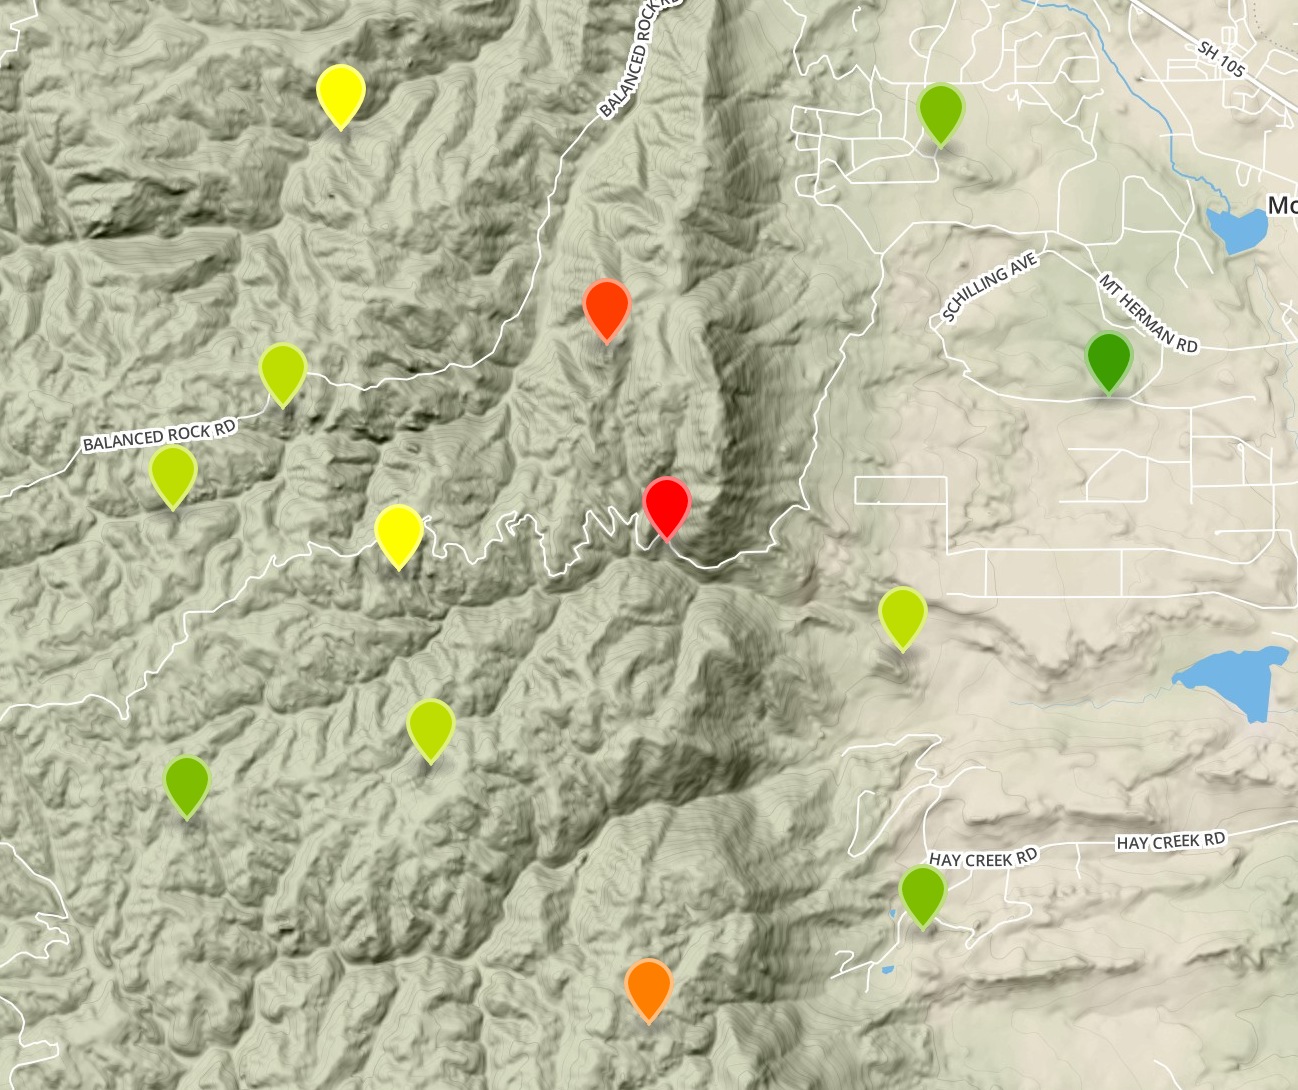
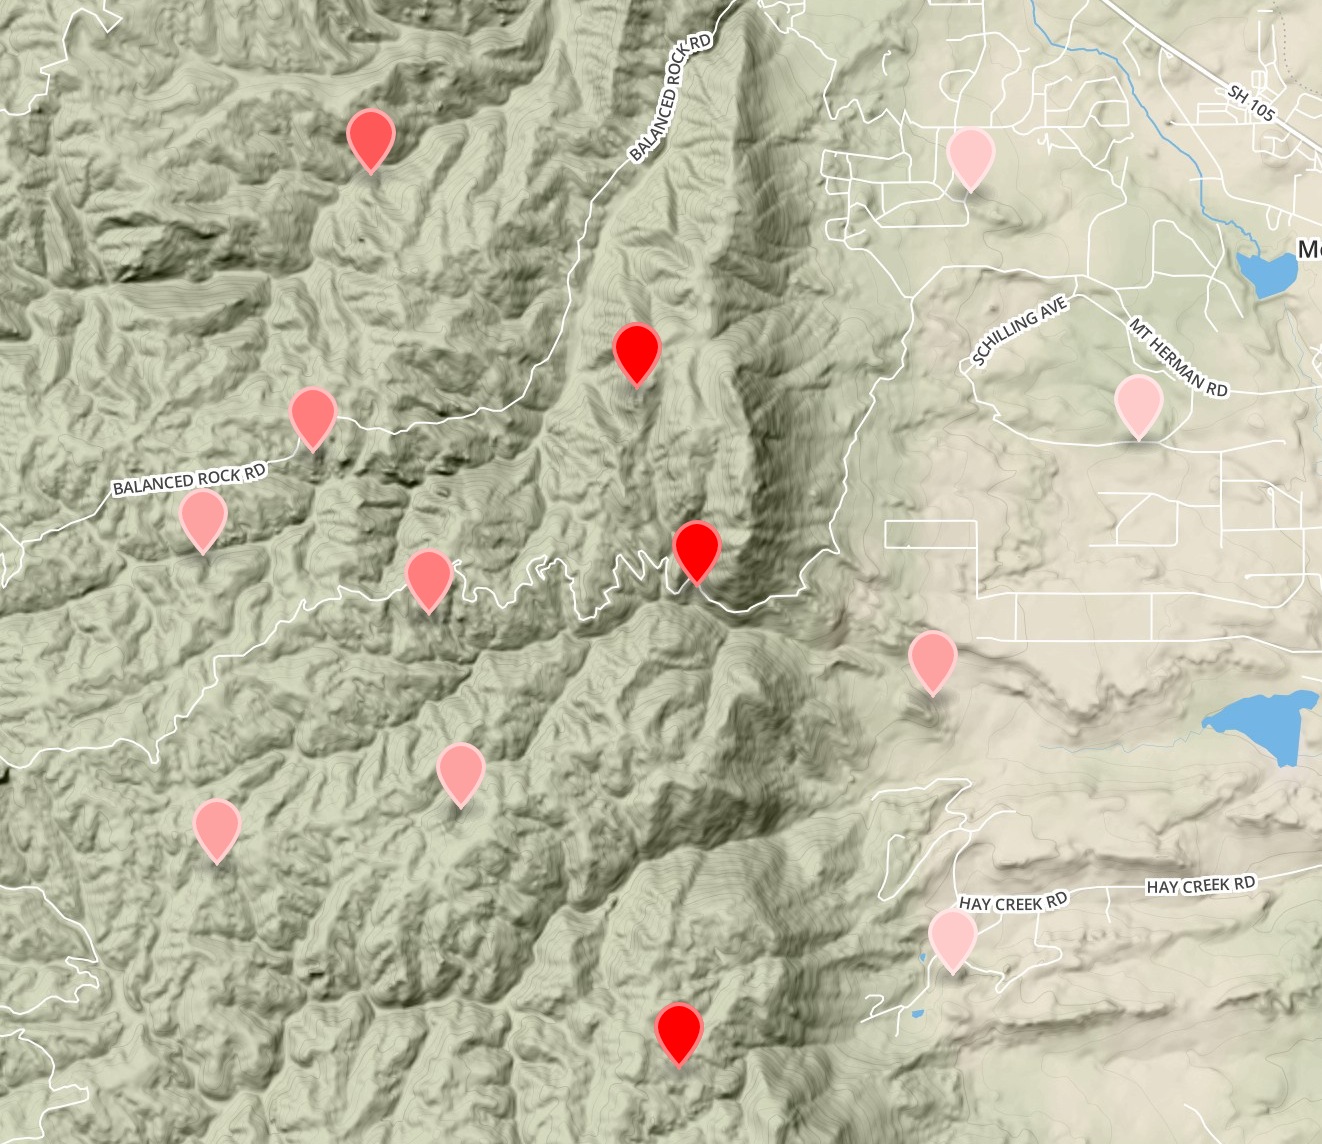
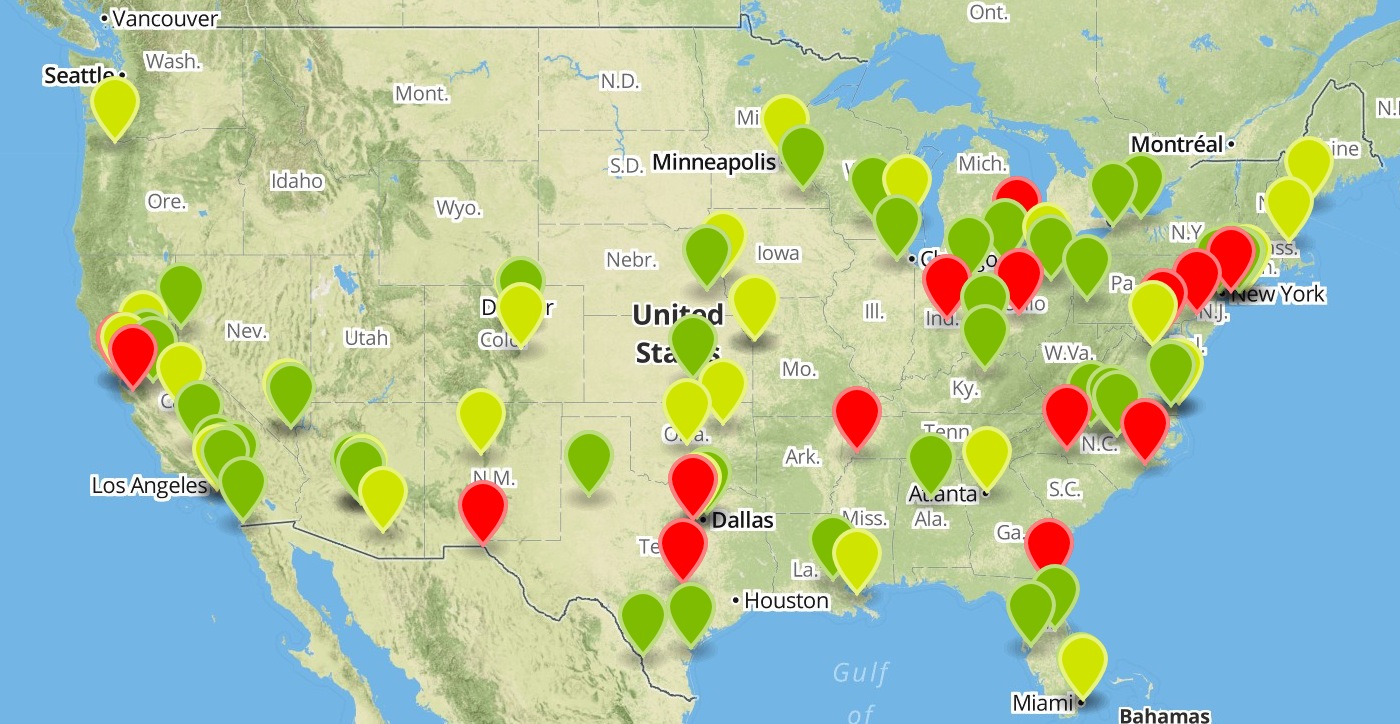
geocolor classifies data contained in geojson properties, and assigns color values based on the simplestyle-spec. This means that when your geojson is rendered in github, gists, mapbox, or other simplestyle-spec compliant renderers, you will get nice styles that help to visualize your data.
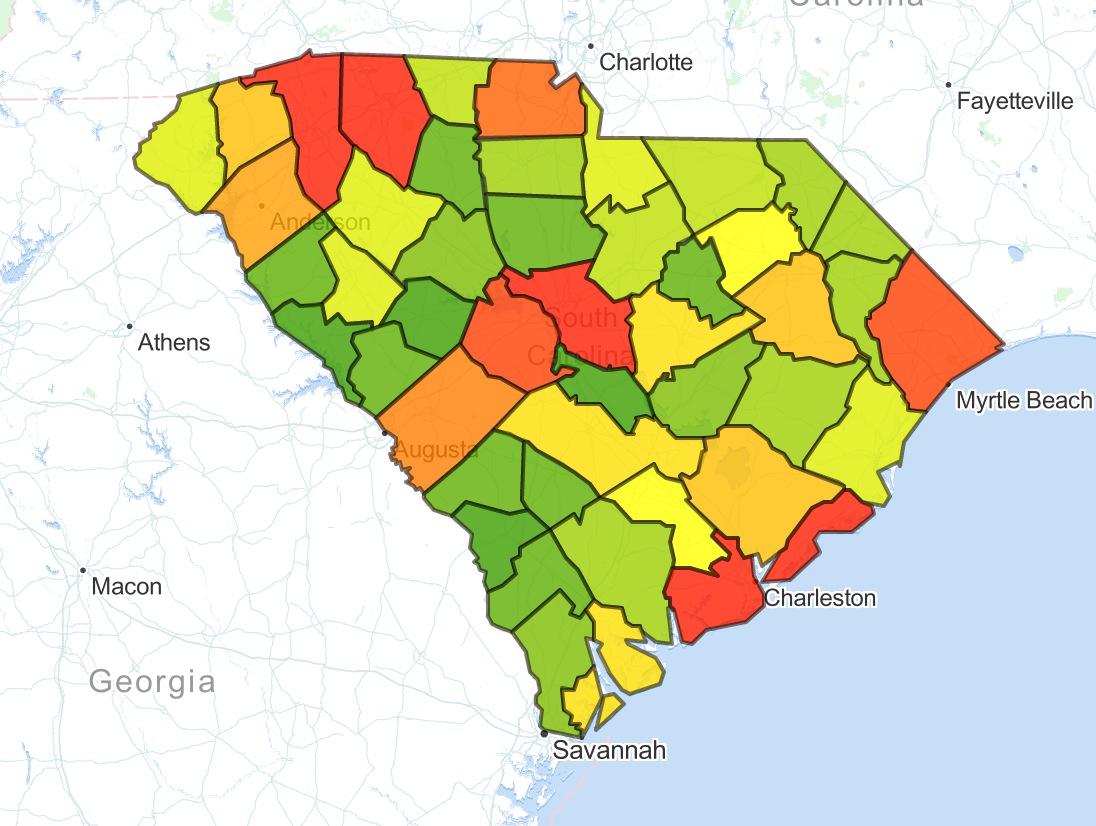
npm install geocolorThe color gradient is defined by simply passing an array of colors with as many stops as you want.
Curently supported classifications:
- equal intervals
- quantiles
- jenks
var geocolor = require('geocolor')

var cities = {
  // [point data](https://github.com/morganherlocker/geocolor/blob/master/test/in/cities.geojson)
}

var z = 'Population',
    classification = 'jenks', // 'quantile' and 'interval' also supported
    numberOfBreaks = 5,
    colors = ['green', 'yellow', 'red']

geo = geocolor(cities, z, classification, numberOfBreaks, colors)

// properties now contains style info with encoded colors
console.log(geo) Running tests:
npm test