
GG.Net lets Data Scientists and Developers create interactive and flexible charts for .NET and Blazor Web Apps.
Taking its inspiration from the highly popular ggpplot2 R package, GG.Net provides natively rich features for your Data Analysis Workflow. Build publication quality charts with just a few lines of code in C# and F#.
 |
 |
 |
 |
 |
 |
 |
 |
 |
 |
 |
 |
 |
 |
 |
 |
 |
 |
 |
 |
 |
- Added new ITransformation class applying max and min limits on values
- better browser support for arcs, as some browser do not support 360 degree arcs (that might be used on pie/donut charts)
- fixed NullReferenceException on linq enumeration when plot was refresh
- fixed color guide in case a transformation function is applied to the data
- fixed typing error
- Added support for predefinied facets, which will be shown always even no data is available for (some of) those predefinied facets
- Added thread-safe ReplaceItems function to Sources for updating data on real-time applications
- Improved calculations of size of facets to make sure all facets have the same size (independently on axis information)
- Fixed a NullReferenceException if Refresh on plot was called, but no component was set
- Fixed a NullReferenceException when ncolumns (but no nrows) was set on Facet_Wrap
- Added: support of rotated labels on x- & y-axis in cartesian coordinates system
- Fixed issuer #5: Guide.ColorBar (Scale_Fill_Continuous) was potentially showing misleading colors as guide on charts depending on the colors chosen and the breaks used (calculated) on the color scale
- Added support for updateable limits and expand limits on refresh of chart via XLim/YLim and XExpandLim/YExpandLim
- Added DateTimePosition axis via Scale_X_Continuous() using type of DateTime, which enables support for expand limits on dates and time values
- Added demo for a self-updating chart of (web site) visitors statistic using DateTimePosition and dynamic Lim & ExpandLim
- Fixed: axis layout was not updated on refresh
- Added support for expand limits as optional parameter to geoms to have a certain range of axis even data is not available for the complete range
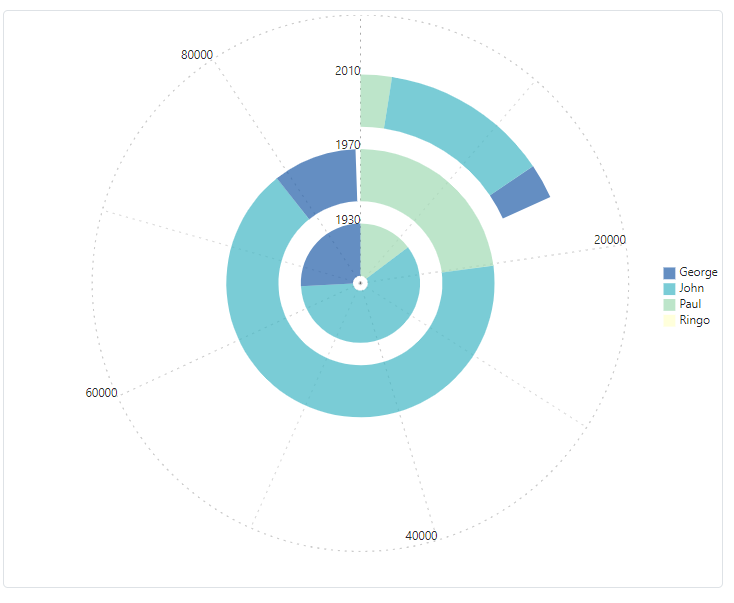
- Added support for coordinates systems (currently cartesian, flip cartesian and polar)
- Added demo for donut and pie chart via polar coordinates