Identifying Potential Investment Opportunities In The Irish Real Estate Market Using Machine Learning
This project has been developed by Javier Castaño Candela.
Final Project - Master in Data Science - KSchool.
This is my final project of the Master in Data Science from KSchool. It consists of a machine learning app that predicts housing prices in the Ireland’s Real Estate Market. Once the prices are predicted they are compared with the actual prices in order to find potential investment opportunities. Bellow you can see the Dash application.

You can find an in-depth explanation of the project in the Wiki section.
The project is structured in three parts and each one correspond with a folder in this repo:
- Data Collection
- Advertisements scraped from daft.ie and complementary data scraped from Geonames.org about eircodes and cities/towns.
- Folder: data_colection
- Potential Investment Opportunities
- This part contains most of the work
- Cleansing and Wrangling tasks
- Feature Engineering Geospatial Data
- Exploratory Data Analysis
- Data Modeling with Machine Learning Algorithms
- Folder: investment-opportunities
- This part contains most of the work
- Dash Application
- The final application which you can see above
- Folder: dashapp
- Notebooks structure
- Kedro Pipeline
- Cleansing and Wrangling
- Feature Engineering Geospatial Data
- Data Analysis
- Prices Prediction - Modeling
- daft.ie
- House advertisements. Example bellow.

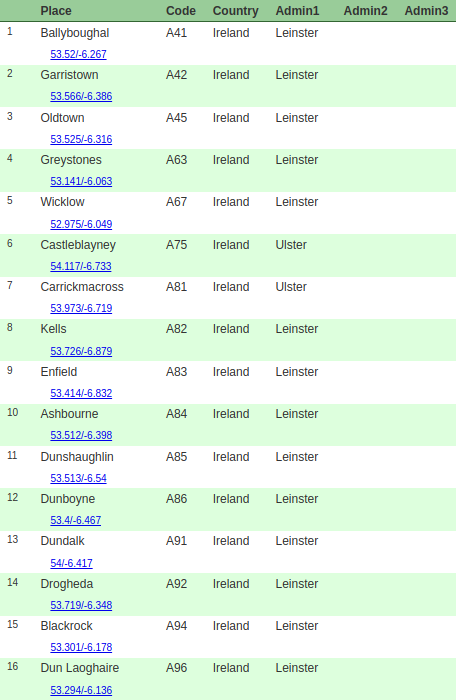
- Geonames.org
- Routing Key from eircodes and cities.
The data scraped with Scrapy were saved in a SQLite3 database. The database will be provided via Google Drive.
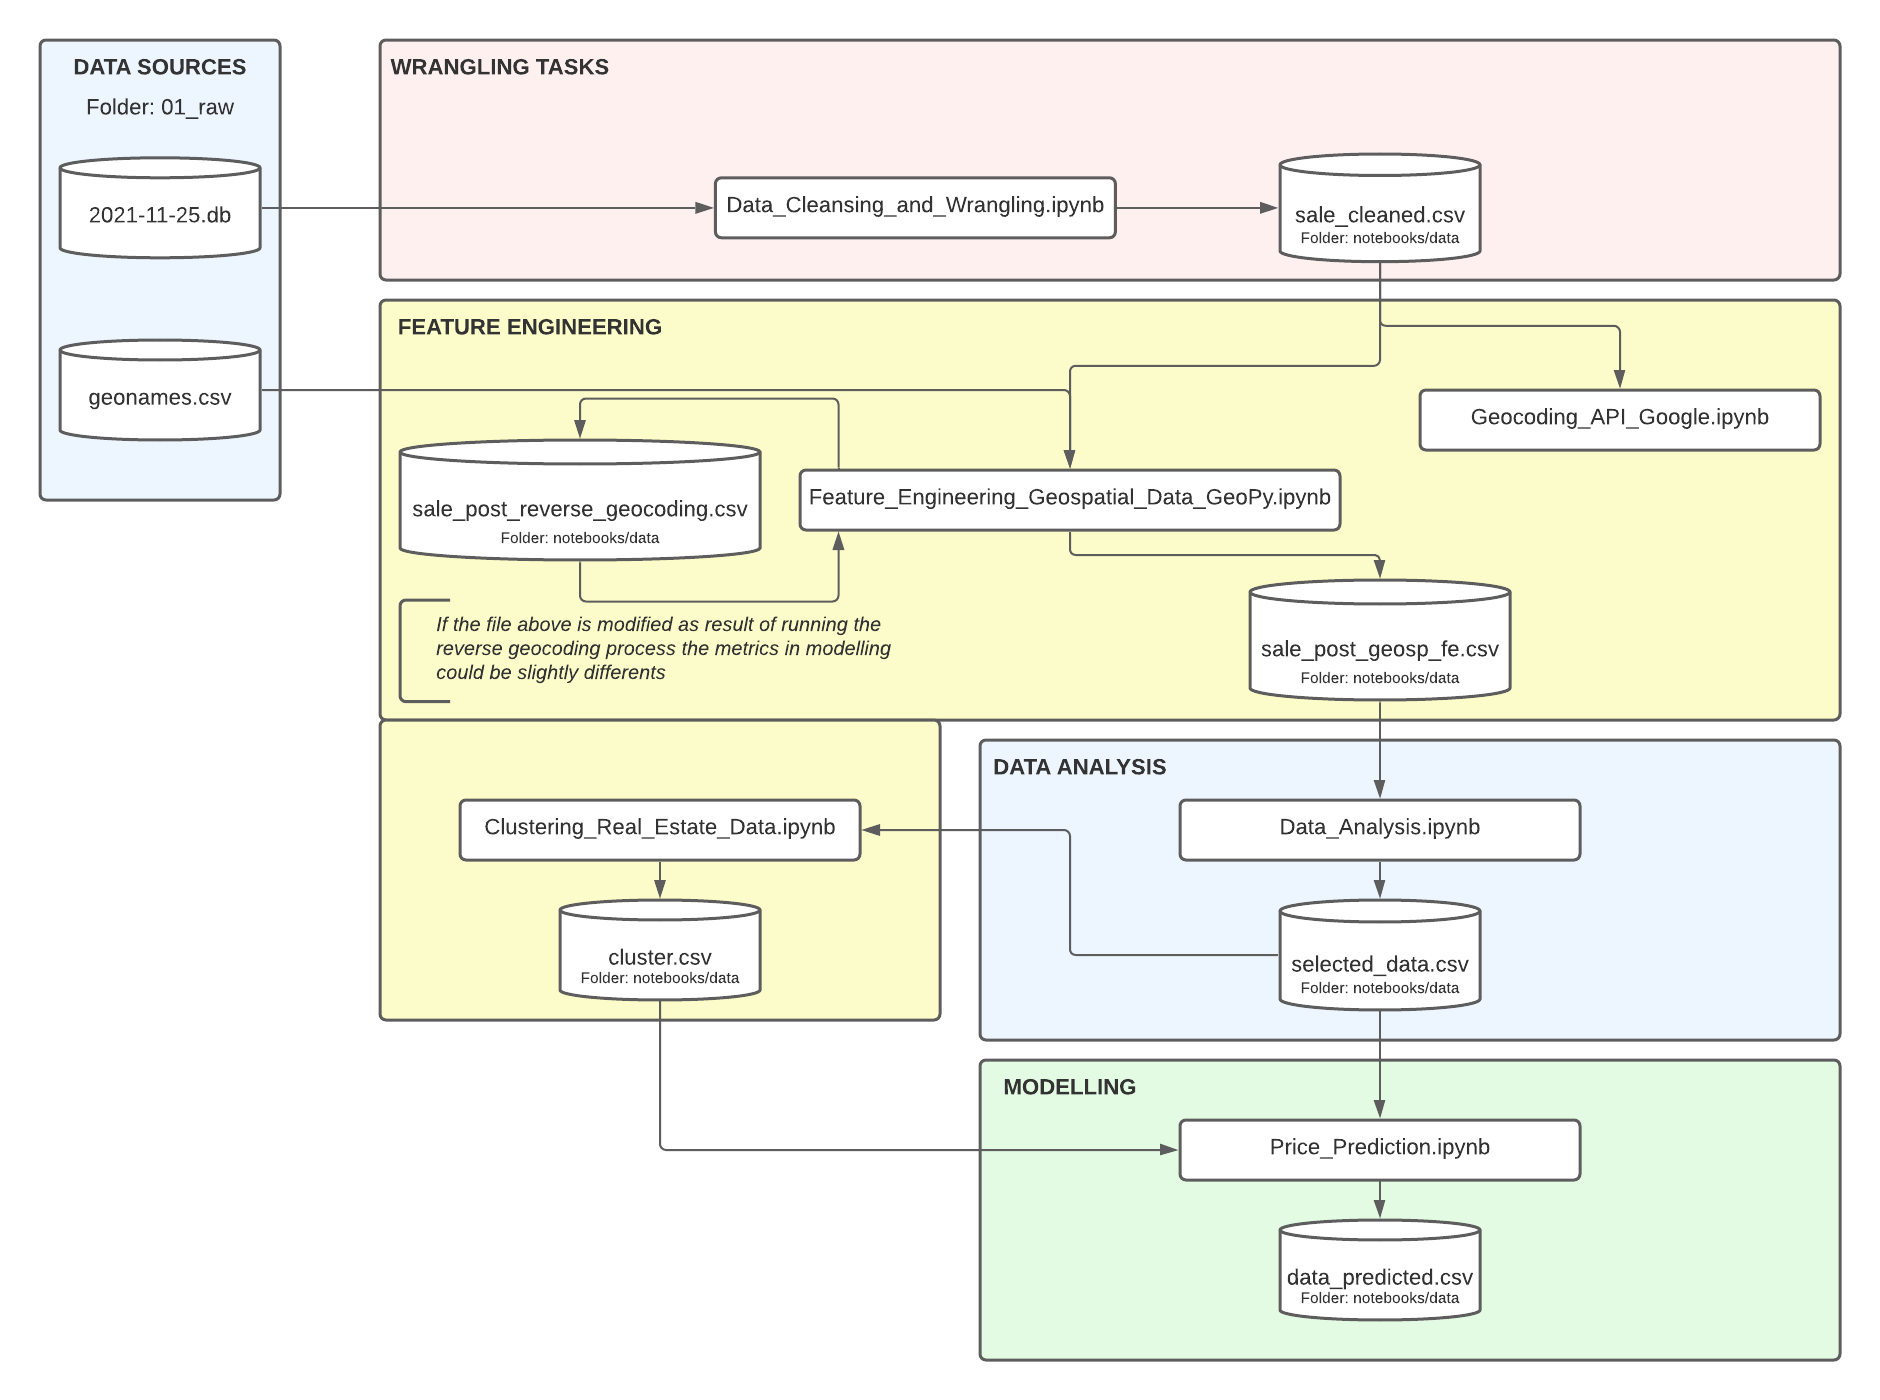
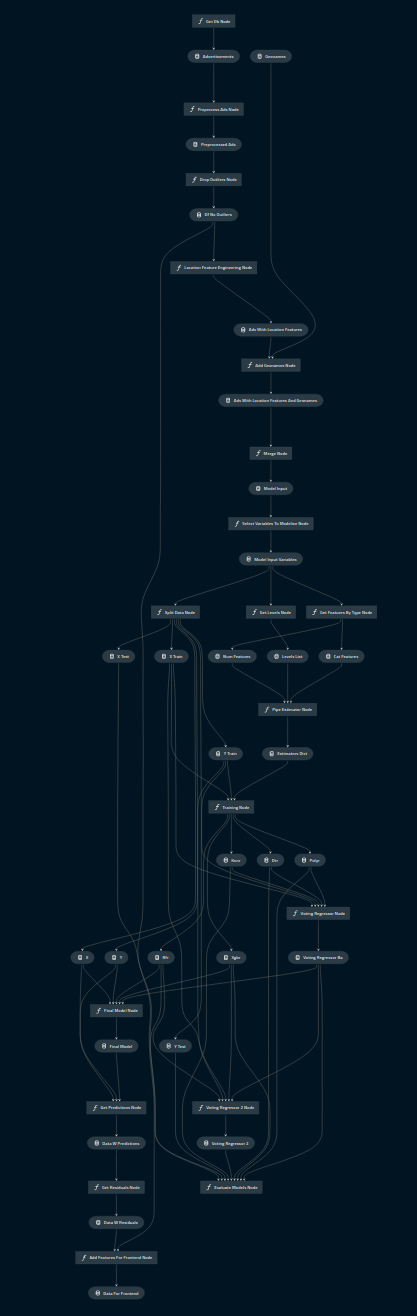
This part was developed in notebooks and then it was relocated in a Kedro project. Bellow you can see the structure of the project via notebooks and via Kedro. You can find an in-depth explanation of the project in the Wiki.
Each feature has been preprocessed in order to give it a properly format.
Methodology
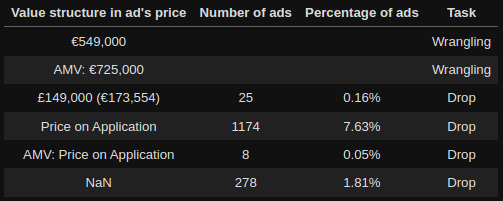
- Detecting the different cases or formats in which the data was and deciding what kind of task apply in it. Once the wrangling tasks were decided the next stept was building a function to do the tasks and finally to apply it.
Example: Price column
pd.DataFrame({'before': sale['price'],
              'after': process_price(sale)['price']}).head(10)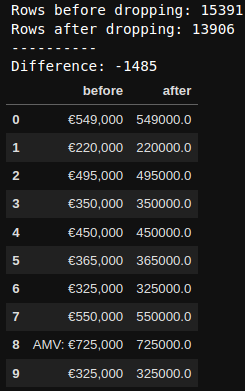
The outliers were handled in the Data Analysis notebook. However, when the prokect was relocated to a Kedro, they were handled in the data_cleansing pipeline which is between the data_processing pipeline (wrangling tasks) and the feature_engineering_geospatial_data pipeline. You cal easily see the Kedro pipeline structure thanks to the Kedro-Viz tool.
In order to obtain more information and being able to make a better analysis I decided to do feature engineering to get the city/town names and other information from the coordinates.
This thecnique is called Reverse Geocoding:
- Reverse-Geocoding is a process used to convert coordinates (latitude and longitude) to human-readable addresses.
The result of the feature engineering process was the this:

The column I was interested most in was the city one. However, it had a lot of missing values. To solve this I used the postcode column to find the names of the cities. I extracted the Routing Key from the postcode and matched it with the one in the data scraped from the Geonames.org. As the Routing Key in the data scraped from the Geonames.org was associated with the place (city/town), it was easy make a new column named place containing that information. After this process I had a column named place with only 1,243 missing values, instead of 5,644 or 6,551.

I did an EDA to try finding some useful insights that would help me with the modeling tasks. Bellow is the structure of my analysis and some insights I obtained.

As expected, Dublin is by far the place with more advertisements in Ireland, followed by Cork and Galway.

Above I put together a chart representing mean prices per city and another one representing mean m2 prices per city.
Insigths
- Places are very importanta in order to predict prices.
- Floor Area could be a potentian predictor, since places with similar m2 prices have high differences in total price.

Insigths
- Type House could be a potential predictor as well. The difference in house prices and apartment prices are high but they m2 prices are similar.
- Type House could proxy a litle the variable Floor Area.
- Is interesting to see that some places as Cork or Galway have m2 apartment prices higher than house ones but houses have higher total prices.
I decided to analyse Dublin and Cork individually since they are the bigger cities. I show bellow some insights from the analysis of Dublin.

Insigths
- Postal Districts have a high impact in prices. They are represented in the routing key.
- Some postal districts have m2 prices really high but some of the smaller total prices, which is again a signal of the importance of floor area in prices.

The insights from the above charts could be simiral to the Ireland's Market ones.

Insigths
- We can easily see visually the possible correlation between:
type_houseandpricefloor_areaandprice
The distribution shapes were heavy skewed to the right and had a lot of outliers.

To detect outliers I used the following two methods jointly. I considered a value as an outlier only when it was detected as one by the two methods.
- Percentile-Based Method
- Interquartile Range Method
After dropping the outliers the cutoff levels were the following:

To check the efects of the data cleansing I did several things. One of them was to calculate some statistics before and after dropping the outliers. As it can be seen from the images bellow the process of dropping outliers transformed the feature's metrics much more similar to a Gaussian ones.
- Before:

- After:

I ploted the effects of the outliers elimination in charts like the bellow one.
- Lines 1 and 2 show the distribution with outliers and without them respectively as well as the probability plots. The red area is that which contains the outliers.
- Lines 3 and 4 show the same that above ones but with a logarithmic transformation after the detection of outliers.
- Lines 5 and 6 show a Box-Cox transformation result.
![]()
Some algorithms are built on the assumption of normality in the distribution so the graphs like the above one made me realise the potetial of some transformations could have in them.
I also study the relationships between variables and I used some feture selection methods in order to figure out the best variables to predict prices.

Relationships:
- There is an increasing linear relationships between
priceandfloor_area.bedroomandbathroomseem to have a mild relationships withpriceand maybe a little stronger one withfloor_area. latitudeandlongitudeboth show two rare patterns wherepriceincreases around two differents coordinates values. Actually these patterns have a logical explanation. The longitude with higher prices matches with Dublin and the other one that stands out from the rest matches with Cork and Galway, as both have similar coordinates. Something similar happens in the latitude plot. Dublin and Galway have similar latitudes and Cork is in the south. We can see this if we look a map as the scatter plot betweenlatitudeandlongitudeand compare it with the other plots.

Conclusions:
- As I concluded from the scatter plots there is a linear relationships between
priceandfloor_area. longitude,bedroom, andbathroomshow interesting relationships with theprice. We can note howbedroomandbathroomare also correlated withfloor_area, which makes sense.- There are no strong decreasing relationships between variables.
I conclude that it would be good looking for more data in order to find more variables with predictive capabilities.

city_district,code,place, andpostcodehave some predictive power to theprice. If we pay attention we can realize that all of them are location variables, which makes sense. Moreover,codeandplaceare exactly the same but with different characters as place was extracted fromcodejust exchanging the Eircode for the corresponding city or town.citieshas some predictive power but is the same thatplacewithout differenciating Dublin postal districts.psrhas some predictive power and it also makes sense because the psr identify the seller. It is reasonable to think that a particular seller will tend to offer houses in the same area or city or in close cities instead of the same number of houses in each city. So I think we could understand thepsras something similar to another location variable.
See the whole analysis in the Data Analysis notebook!
The bellow methods were used:
- Recursive Feature Elimination
- Linear Regression Scores
- Decision Tree Regression Scores
- Forward Feature Selection
- Linear Regression Scores
- Decision Tree Regression Scores
- Backward Feature Elimination
- Linear Regression Scores
- Decision Tree Regression Scores
Conclusion
Having into account the three methods and the fact that psr could be similar to place or a location feature the five variables I choosed were the following ones:
floor_arealatitudelongitudebedroombathroom
After the full analysis made I selected the following variables as predictors in order to predict the houses prices:
floor_arealatitudelongitudebedroombathroomplacetype_house
To see the transformations applied to the variables and the missing values traetment as well as an in-depth explanation go to the Prices Prediction notebook or to the Wiki
The graphs bellow shows the models tested and the metrics obtained for each model.
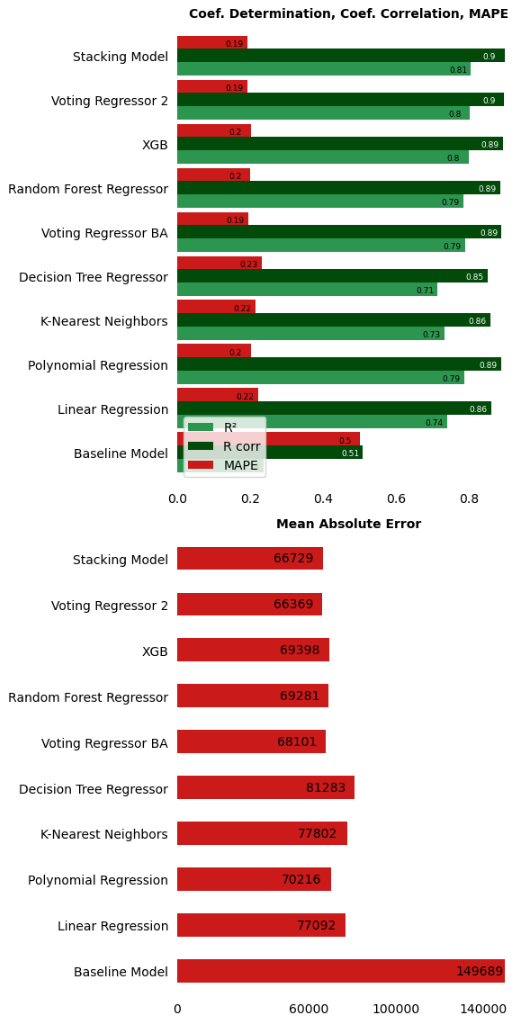
As you can see the model with better performance is the Voting Regressor 2. The voting regressor averages the individual predictions of the learners to form a final prediction. The learners which make up the voting regressor 2 are the following:
- Voting Regressor Basic Algorithms (it is provided with other three learners)
- Polynomial Regression (degree 4)
- K-Nearest Neighbors Regressor
- Decision Tree Regressor
- Random Forest Regressor
- XGboost
The Voting Regressor 2 is able to improve the Baseline Model by 83,000€! Which mean a 56% less MAE. It also improve the second best model (Voting Regressor Basic Algorithms) by 1,500€ which mean only a 3%. My selected model was the Voting Regressor 2, but if you are concerned about the complexity of the models, you could choose the Polynomial Regresion since its performance is almost the same.
| Improvement respect Baseline Model (MAE) | Improvemenet respect Best Last Model (MAE) |
|---|---|
| 83,320€ | 1,732€ |
| 56% | 3% |
-
The best models obtain coefficient of determination around 0.8 so those models are able to explain an 80% of the variability in prices. In Mean Absolute Error terms this is an error between 66,000€ and 70,000€ aproximately in test set. This is not a bad score taking into account the low number of features we are worked with and the mean prices in Ireland. Also it is improving the Baseline Model by around 80,000€ so I am happy with that since the mean prices are so high in Ireland.
-
One surprising thing is that the Polynomial Regression has quite similar metrics than the XGBoost or the Random Forest. Despite the fact that I choosed the Voting Regressor 2 as the final model because it is the best one, it would make sense to use a much simpler model as the Polinomial Regressor if you are concerned about model's complexity since it is very good as well as simple.
-
Most of models tend to understimate houses prices which actual prices are over a million euros. Despite most houses are in the range price under a million this is still worrying. Our models are able to learn the relationship between preditor variables and the response variable better when the actual price of the house is under a million. That could be due to a lack of samples of expensive houses or due to a lack of predictors that can explain better the relationship with the price when it is too much high. Some predictors that perhaps explain that expensive prices could be the house year of construction, the average anual income of residents in areas with expensive prices, etc.
-
Another important aspect is the type of error that is less dangerous. Our model will be used to find potential investment opportunities which means that if the model understimates a house price, that house would be less interesting to us as investemnt opportunity, discouraging us to invest money in that operation. That means that we would not win money but we would not loss it either. However, if the model tends to overstimate the price of a house it would be encouraging us to invest in that house so we could buy an asset which actual value is lower than its actual price. That means that we could loss money. So we can conclude that a model that tends to understimate asset prices is less dangerous to us that one that tends to overstimate them.
| Model | MAE | R² |
|---|---|---|
| Voting Regressor 2 | 66,369€ | 0.80 |
| Stacking Model | 66,729€ | 0.80 |
- The Voting Regressor 2 is able to improve the Baseline Model by 83,000€, which mean a 56% less MAE.
- Voting Regressor Basic Algorithms (it is provided with other three learners)
- Polynomial Regression (degree 4)
- K-Nearest Neighbors Regressor
- Decision Tree Regressor
- Random Forest Regressor
- XGboost
| Model | MAE | R² |
|---|---|---|
| Baselime Model | 149,689€ | 0.23 |
| Decision Tree Regressor | 81,283€ | 0.71 |
| K-Nearest Neighbors | 77,802€ | 0.73 |
| Linear Regression | 77,092€ | 0.74 |
| Model | MAE | R² |
|---|---|---|
| Polynomial Regression | 70,216€ | 0.78 |
The Polynomial Regresion with degree 4 has a pretty good performance and is simplest than the Voting Regressor 2.
-
Most of models tend to understimate houses prices which actual prices are over a million euros. The models are able to learn the relationship between preditor variables and the response variable better when the actual price of the house is under a million euros.
-
This could be solved collecting more advertisements or finding new predictors variables capable of better explaining the higher prices.
-
Since we are using the model to find potential investment opportunities, having a model that tend to understimate prices is less dangerous than one that tends to overstimate them.
I like thinking about this project as a prototype for a future data product. New ideas come to my mind quite often to improve the work but they go beyong the scope of my project for now. Some of them are the following:
- Collecting more data. I am currently learning about databases, Apache Airflow, and SQL to be able to make ETL pipelines and schedule all the process. I think it would be useful to collect all new ads from daft.ie daily and save them in a database to train the models with more data, maybe a whole month.
- Obtaining more variables. There area a lot of variables that could be used as predictor variables.
- Distance from houses to diferent points of interest.
- Weather data in each place.
- Income level per capita and area or city.
- Demographic data.
- Trying new models and maybe deep learning.
- Building models for houses with prices over a million euros to check whether that improve the metrics.
- Improving the frontend.
The Dash Application is showed at the beggining and you can see the code here.
Tha application has been deployed to Heroku and you can visit it here:
https://ireland-dashboard-houses.herokuapp.com/
- Unfortunately the Dash application does not display properly when the screen is too small. This is something that I need to improve in the future.
To run the project follow the instructions in the wiki