Using Daloopa API to pull SIVB balance sheet data.
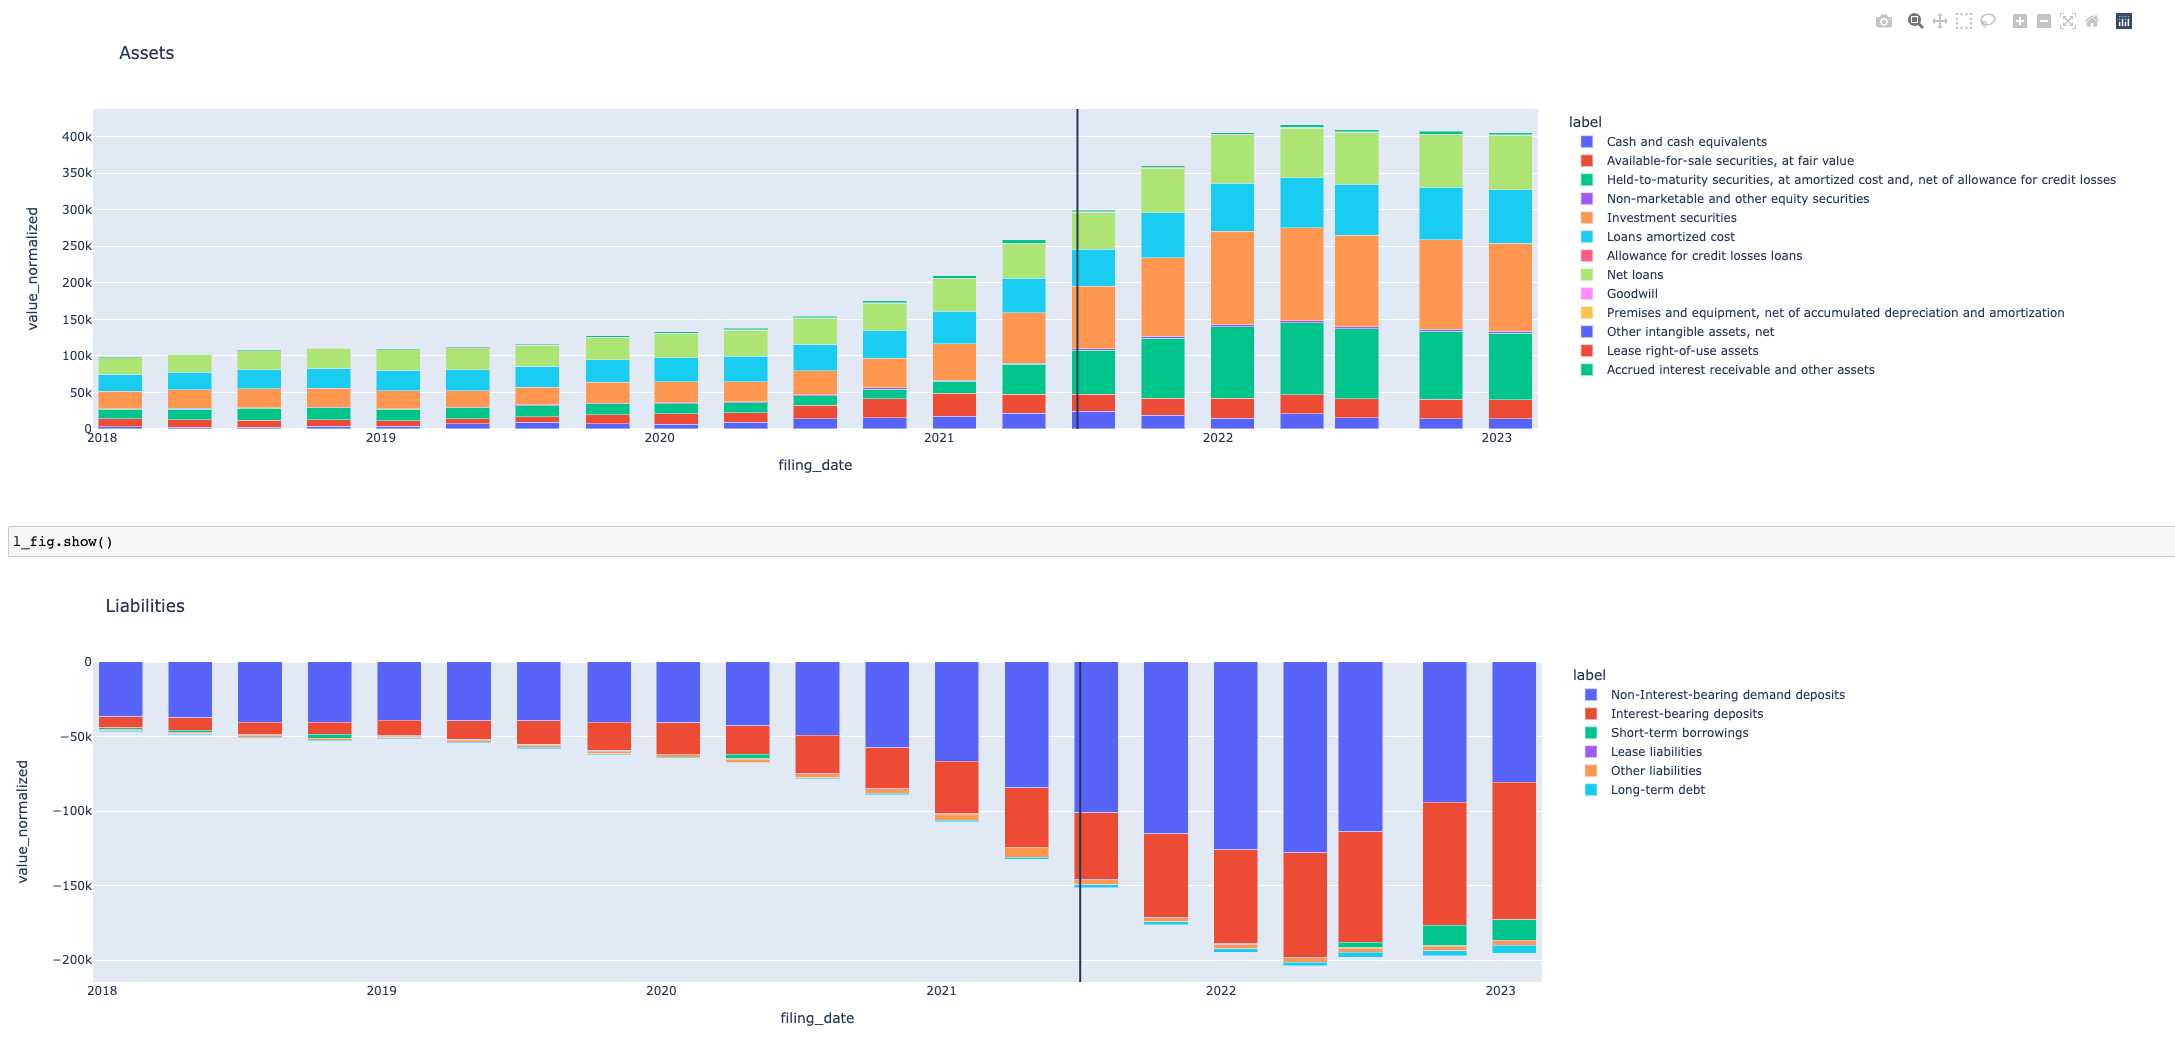
I was curious whether it was easy to SEE what drove the issues at SIVB.
I noticed a huge ramp in the balance sheet in late 2021 thru mid-2022.
Turns out https://www.svb.com/news/company-news/svb-financial-group-completes-acquisition-of-boston-private2 this was in PART the acquisition of Boston Private.
The deal closed 7/1/2021 so the actual reporting impact I believe would have been the quarter AFTER.
However, BPFH was only ~10bn in total assets vs ~200bn at SIVB.
Rather, it looks more like BPFH was part of a larger initiative to grow the balance sheet thru this period to mid-2022.
4 Year Chart of assets and liabilities: