This page contains information related to the analysis of the data in Sherwood et al, 2022. In this paper, we use the CapZyme-seq method to identify RNAs that are 5' capped with the metabolic cofactor Flavine Adenine Dinucleotide (FAD).
The CapZyme experiment compares a Control sample to a sample treated with an enzyme (AtNUDX23, Rpp or other), which specifically generate mono-phosphate at the 5’ terminal of RNAs depending on their 5' termini. Subsequent 5’ monophosphate specific ligation of a sequencing adaptor to RNAs allows the RNAs with a 5' modification (such as FAD) to be enriched in a sequencing experiment. This page decsribes the method used in Sherwood et al, 2022 to analyse the data.
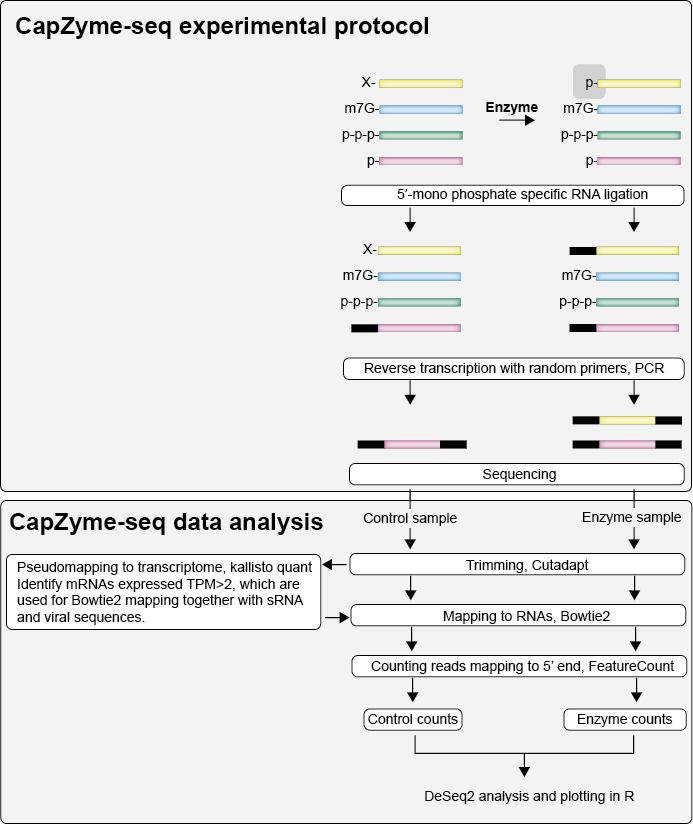
CapZyme-seq bash data analysis, described in CapZyme-seq.sh (https://github.com/jeppevinther/CapZyme/blob/main/CapZyme-seq.sh):
- Trimming with cutadapt
- Pseudo mapping to entire transcriptome with kallisto
- Mapping to expressed mRNAs + viral RNAs + small RNAs with Bowtie2
- BAM to SAM files with samtools
- Counting CapZyme 5' termini reads with FeatureCount
- Accessory analysis: Analysis of 5 termini nt sequence
- Accessory analysis: Making sequencing depth file containing sequencing depth for all mapped RNA for the different samples.
- Accessory analysis: Making wig file containing sequencing depth for all mapped RNA for the different samples, for upload to UCSC genome browser.
CapZyme-seq R data analysis, described in CapZyme-seq.R (https://github.com/jeppevinther/CapZyme/blob/main/CapZyme-seq.R)
- Importing CapZyme 5' termini reads (FeatureCount files) into R
- Analysis with DeSeq2
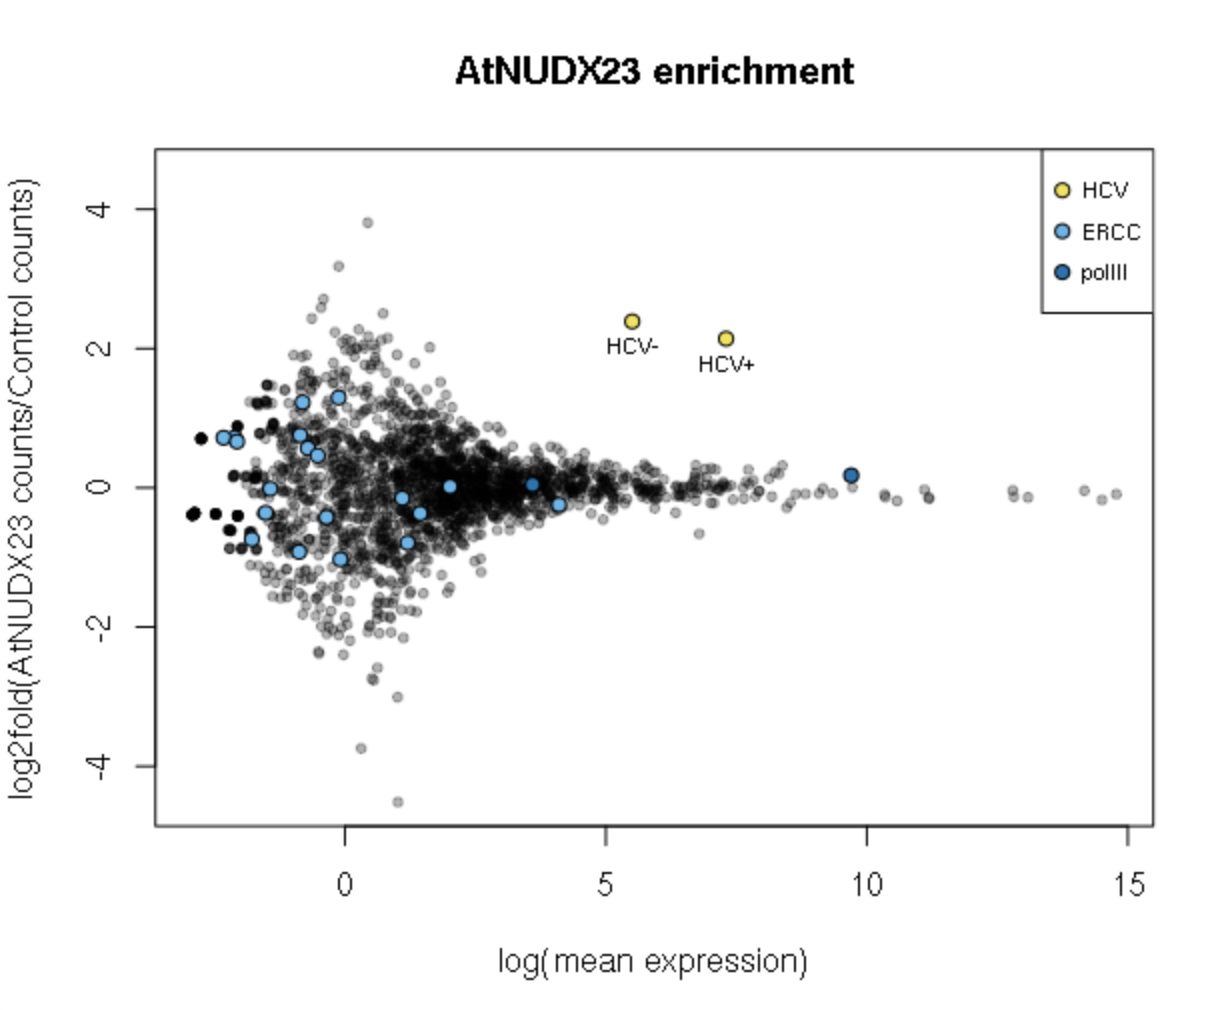
- Plotting the CapZyme data
- Accessory analysis: Analysis and plotting of 5 termini nt sequence
- Accessory analysis: Analysis and plotting of sequencing depth for specific RNA
Using the scaled-down example data, the main finding of Sherwood et al, 2021 can be reproduced: