Analysis of click-through rate using the avazu data set from a finished Kaggle competition.
Practically, the success is defined as: sum(clicks)/(sum(clicks) + sum(non-clicks)) for more details and notes about confidence intervals, see the notebook about successful app_domain
Each discrete questions is answered in an ipython notebook. These notebook go through the reasoning leading to the answer. The backend of these notebooks consists of two python modules:
- click_succ.py for basic success calculation.
- time_click.py for time-related calculation and plotting.
In order to save time, the dataframe created from the csv file can be saved (pickled) in a given directory with the following command
storing_data.save_df_by_chunk('data/train.csv')
the dataframe will by saved in 10 pickle files in the directory pkld_data
under the names pkled_chunk_?.pkl, where ?=0,1,2....
The dataframe can be loaded in the following way
storing_data.get_df('pkld_data/')
The above code assumes that the storing_data.py module is imported:
import storing_data
It also assumes that the directory pkld_data/ exists
and that the csv file is in the ./data/ directory.
As an example, the notebook notebook/distinct_ads.ipynb uses the pickled dataframe that was saved in pkld_data/.
Finally, for testing purposes, the argument max_chunks=[some int < 10]
can be provided to get_df to get a dataframe with less data.
Warning: make sure there are no pkled_chunk_?.pkl files
already in pkld_data/. This check should be added to the code.
- python 2.7
- ipython 3.0.0
- pandas 0.16.1
- matplotlib 1.4.3
The code assumes the data to be in ./data/
- How many distinct ads were shown for the 10 day period in total and per day? answer and code in notebook/distinct_ads.ipynb
- Which app_domain is the most successful? answer and code in notebooks/successful_app_domain.ipynb
- Which banner position is the most successful? answer and code in notebooks/successful_banner.ipynb
- Provide the top 10 most successful site_categories for the 10 day period? answer and code in notebooks/top10_site_category.ipynb
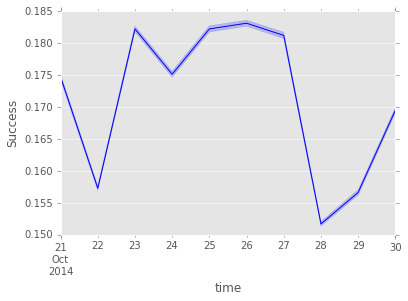
(plots for this section were produced in this notebook) As a reference for any successful field, the following plot shows the overall success of all the adds for each day of the data set.
Here is a bar chart of the most successful value for each field
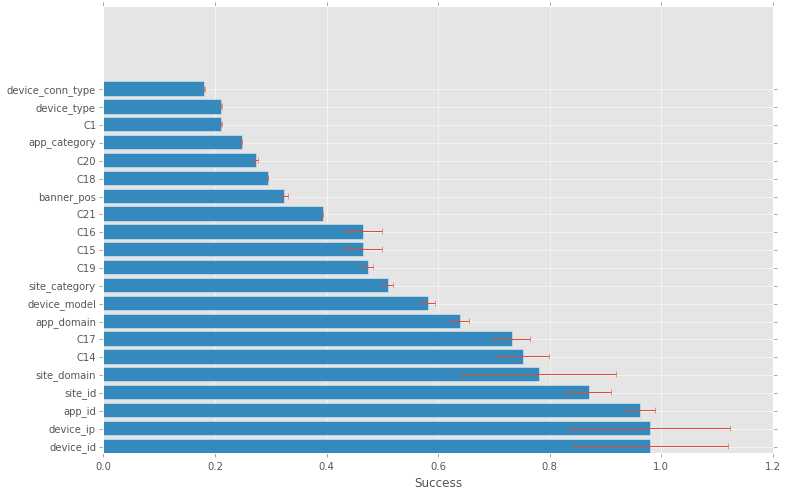
The most successful ones, device_id & device_ip, have a small number of clicks, reflected by the larger error bars, but seems to be credible. The small number of impressions, if true, makes those successful field values less interesting for prediction since they happens so rarely.
Relationship between fields can be checked with variation correlations over time. Here is an example of highly correlated values,
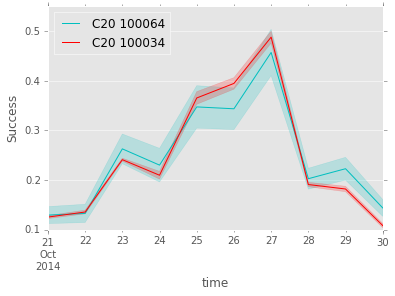
This can be use to predict the success of one value when there is only data on a correlated value.
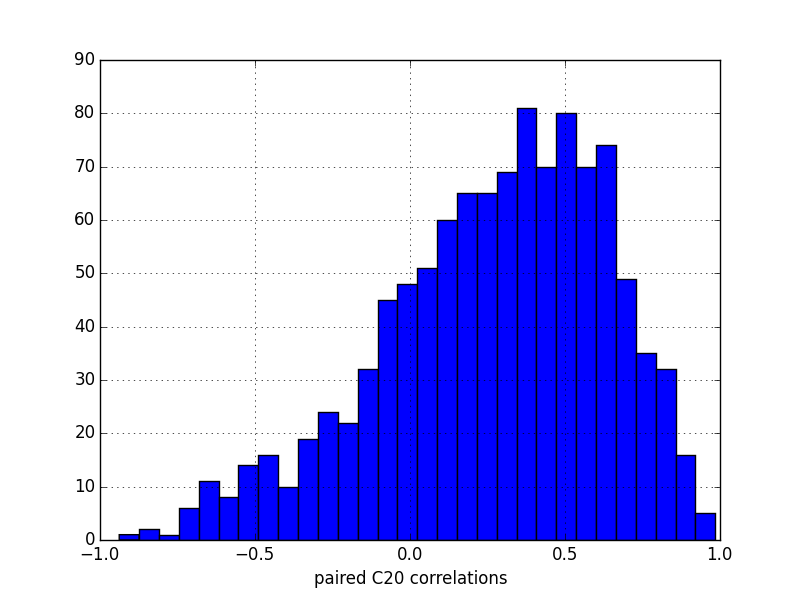
Some field contains more correlations between their values than others, here is the distributions of the 100 most successful paired values of the C20 field:
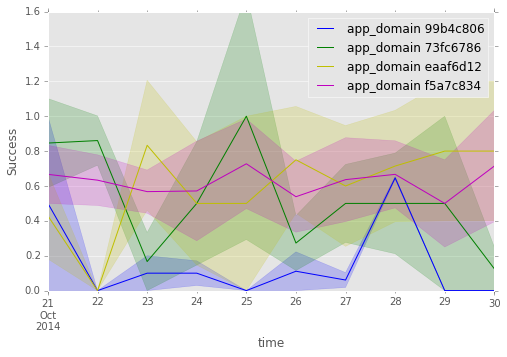
Clearly, app_domain 99b4c806 is only significantly successful one day, the 28th, but its number of impressions is so large that they overwhelm clicks from all other days of lower success. The following plot shows how the distributions of some fields on the 28th and the rest of the data set.
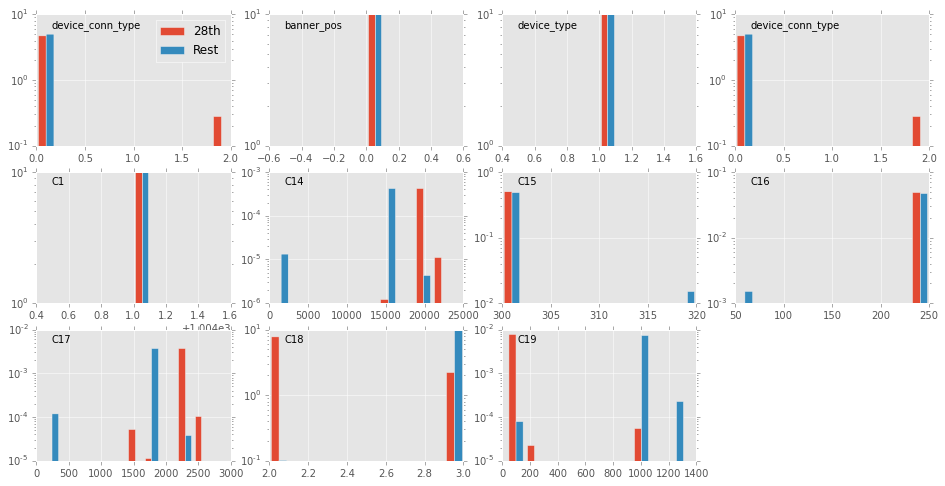
(code to produce this last plot in notebooks/app_domain_28th.ipynb)
There are four fields that are clearly different on the 28th: C14, C17, C18 & C19. Some of them most likely influence the success. Indeed, C14 and C17 have values that can have very high success. This could be investigated by looking at which combinations are successful on the 28th and see if they are still successful (but less frequent) on other days.
The avazu data set is a clear example of the need for machine learning tools to achieve predictions on the click-through rate. Some trends have been shown above, but not all are not consistent in time. A multidimensional analysis could take into consideration all the fields of the data and learn the click behavior. Finally, these click-through rate is likely to be unreliable in "real-life" data since "click records and non-click records are subsampled based on different sampling strategies" as explained in the kaggle forum.