path/referrer snapshot time series: bad total time range after merge #36
Comments
|
Initial investigation showed that in the above's special case the linkedin.com time series determined the overall range shown. That is, as part of merging individual time series the data ranges not within the linkedin.com time series range were lost. |
|
Found the problem: Line 519 in 47d5047 Done 'right' million times before, here I somehow fell for pandas and expected it to do magic. Which it did not. Created this snippet to show the problem, and a solution: dfa = pd.DataFrame(
list(range(10)),
columns=["A"],
index=pd.date_range("2021-01-03", periods=10, freq="D"),
)
dfb = pd.DataFrame(
list(range(10)),
columns=["B"],
index=pd.date_range("2021-01-10", periods=10, freq="D"),
)
print(dfa)
# A
# 2021-01-03 0
# 2021-01-04 1
# 2021-01-05 2
# 2021-01-06 3
# 2021-01-07 4
# 2021-01-08 5
# 2021-01-09 6
# 2021-01-10 7
# 2021-01-11 8
# 2021-01-12 9
print(dfb)
# B
# 2021-01-10 0
# 2021-01-11 1
# 2021-01-12 2
# 2021-01-13 3
# 2021-01-14 4
# 2021-01-15 5
# 2021-01-16 6
# 2021-01-17 7
# 2021-01-18 8
# 2021-01-19 9
# naive merge: just add a column from one dataframe to the other dataframe,
# and expect magic to happen
dfa['B'] = dfb['B']
# But what happens is that the index of the dataframe added to stays the same:
print(dfa)
# A B
# 2021-01-03 0 NaN
# 2021-01-04 1 NaN
# 2021-01-05 2 NaN
# 2021-01-06 3 NaN
# 2021-01-07 4 NaN
# 2021-01-08 5 NaN
# 2021-01-09 6 NaN
# 2021-01-10 7 0.0
# 2021-01-11 8 1.0
# 2021-01-12 9 2.0A solution is to concat along a specific axis: merged = pd.concat([dfa['A'], dfb['B']], axis=1)
print(merged)
# A B
# 2021-01-03 0.0 NaN
# 2021-01-04 1.0 NaN
# 2021-01-05 2.0 NaN
# 2021-01-06 3.0 NaN
# 2021-01-07 4.0 NaN
# 2021-01-08 5.0 NaN
# 2021-01-09 6.0 NaN
# 2021-01-10 7.0 0.0
# 2021-01-11 8.0 1.0
# 2021-01-12 9.0 2.0
# 2021-01-13 NaN 3.0
# 2021-01-14 NaN 4.0
# 2021-01-15 NaN 5.0
# 2021-01-16 NaN 6.0
# 2021-01-17 NaN 7.0
# 2021-01-18 NaN 8.0
# 2021-01-19 NaN 9.0 |
jgehrcke
added a commit
that referenced
this issue
Nov 23, 2021
Fix #36 by explicitly merging time series
using pd.concat() along the 'right' axis.
jgehrcke
added a commit
that referenced
this issue
Nov 24, 2021
Fix #36, improve style, align time ranges, and misc
Sign up for free
to join this conversation on GitHub.
Already have an account?
Sign in to comment
This shows a range between Sep and Oct:
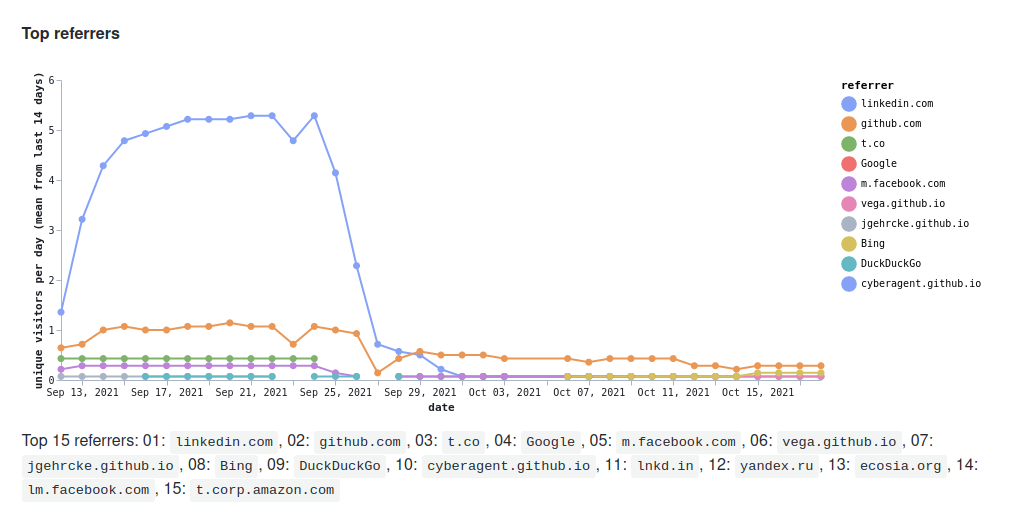
Whereas the expected range would be between Jan and Nov.
The text was updated successfully, but these errors were encountered: