GEDSpy is the python library for gene list enrichment with genes ontology, pathways and potential drugs
![]()
Institute of Bioorganic Chemistry
Polish Academy of Sciences
Department of Molecular Neurobiology
Polish Academy of Sciences
Department of Molecular Neurobiology
GEDSpy is the python library for biological data analysis uses. It is helpful for RNAseq, single-cell RNAseq, proteomics, and other OMIC high-throughput biological analysis where are obtained lots of differentials expressed genes or proteins. GEDSpy is based on Gene Ontology [GO], PANTHER, KEGG and Reactome information. For potential drugs searching was used ZINC platform.
Used data bases:
- Gene Ontology [http://geneontology.org/]
- PANTHER [http://www.pantherdb.org/]
- KEGG [https://www.genome.jp/kegg/]
- Reactome [https://reactome.org/]
- ZINC [https://zinc.docking.org/]
pip install GEDSpy
gene_list = ['CACNA1I','CALD1','CAMK1G','CAMK2N1','CAMSAP1','CCL15','CCL16','CCNL2','CCT8P1','CD46','CDC14A','CDK18','CDK19','CES3','CHEK2',
			 'CHID1','COL6A3','CPVL','CYP3A43','CYP3A5','DBNL','DUSP10','DUSP9','ECHS1','EGFR','EGR2','ELL2','ERMP1','ESR1','F7','FAM171A1',
			 'FAM20C','FGFR2','FH','FLAD1','FUT3','GAA','GBA2','GGCX','GJB1','GLRX5','GNAI2','GNB2','GNB3','GPNMB','GRB10','GRHPR','HMGCS2',
			 'HSD17B4','HSP90AB1','IER3IP1','IGF2R','IL1R1','INF2','IRAK1','ITGA1','ITGA7','ITIH1','ITIH3','ITIH4','ITPR1','ITSN1','JAK1',
			 'KALRN','KCNQ2','KCNQ4','KDM3A','KIAA0090','KIAA1161','KMO','KRAS','KSR1','LAMA5','LAMB2','LCN2','MAP2K7','MAP4K2','MAP4K3',
			 'MAPK13','MARCO','MAST2','MAT1A','MATR3','MCM8','MFSD10','MGAT5','MTMR10','MUSK','MYO9B','NBAS','NCOA6','NCSTN','NDUFA4','NEK4',
			 'NPR2','NUDT2','NUP210','ORC3L','PAOX','PEMT','PEX14','PFKL','PHKA2','PIM1','PLXND1','PMM1','PON3','POR','PPARG','PPARGC1B',
			 'PPP2R1A','PRKCE','PTK2B','PTP4A1','PTPN23','PTPRF','PTPRK','RARA','RNF10','RNF14','RNF165','ROCK2','RRBP1','RREB1','SCN1A','SDC1',
			 'SEPHS1','SERPINA1','SERPINA10','SFXN5','SHROOM1','SIL1','SIRPA','SLC12A7','SLC13A3','SLC16A2','SLC17A7','SLC22A23','SLC22A9',
			 'SLC23A2','SLC25A11','SLC25A25','SLC38A3','SLC45A3','SLC4A5','SLC5A1','SLC7A2','SLC8A3','SLC9A6','SLCO1A2','SLCO1B3','SMARCA2',
			 'SNRK','SNX4','SORBS1','SPEN','SPR','SRF','STAB1','STAT1','SUCLG2','SULT1B1','SULT1E1','TBC1D2B','TCHP','TGFBI','TGOLN2','THPO',
			 'TIE1','TIMM13','TLK2','TMEM62','TNFSF14','TNK2','TNS1','TPI1','TRIB3','TRMT11','TTYH3']
import GEDSpy
res1 = GEDSpy.GOPa.gopa_enrichment(gene_list, species = 'hs')
- gene_list - list of analyzed genes
- species - ['ms'] mouse | ['hs'] homo sapiens. Default: 'hs'
res2 = GEDSpy.GOPa.gopa_stat(res1, p_val = 0.05, adj = 'BF', dir = 'results', name = 'GOPa')
- p_val - lower threshold for significant p-value. Default: 0.05
- adj - ['BF'] Bonferroni adjusted of p-value or ['None'] lack of adjusting. Default: 'None'
- dir - graph saveing place. Default:
CWD/results - name - graph name prefix. Default: 'GOPa'

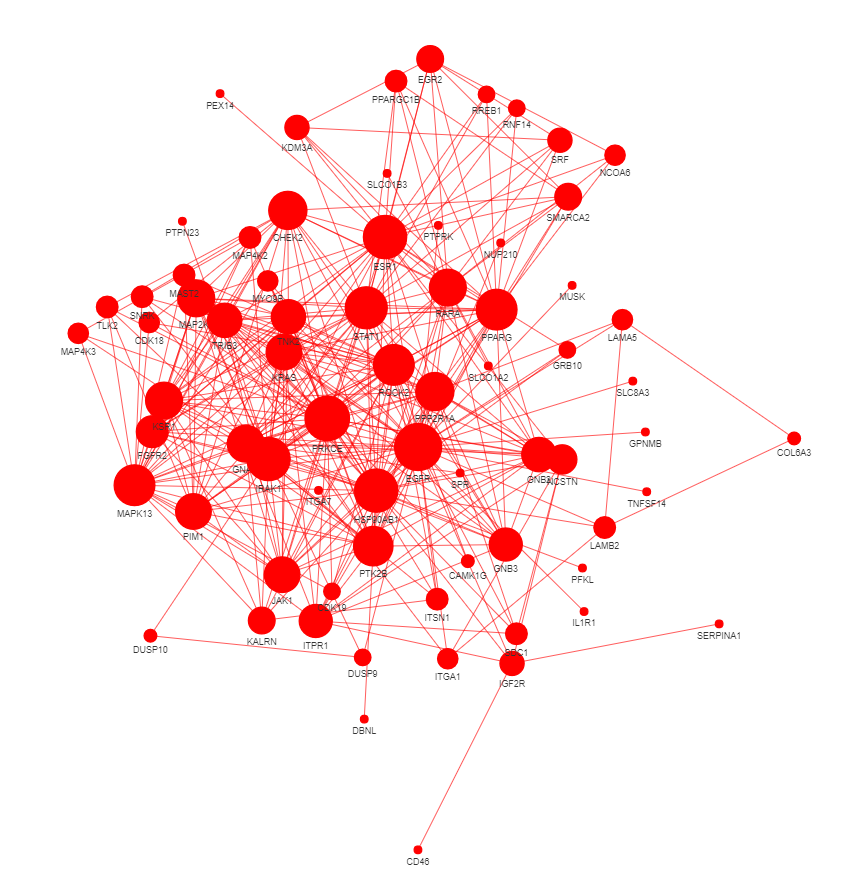
res3 = GEDSpy.GOPa.gene_network(res2, p_val = 0.05, adj = 'BF', dir = 'results' , name = 'gene_relation')
- p_val - lower threshold for significant p-value. Default: 0.05
- adj - ['BF'] Bonferroni adjusted of p-value or ['None'] lack of adjusting. Default: 'None'
- dir - graph saveing place. Default:
CWD/results - name - graph name. Default: 'gene_relation'
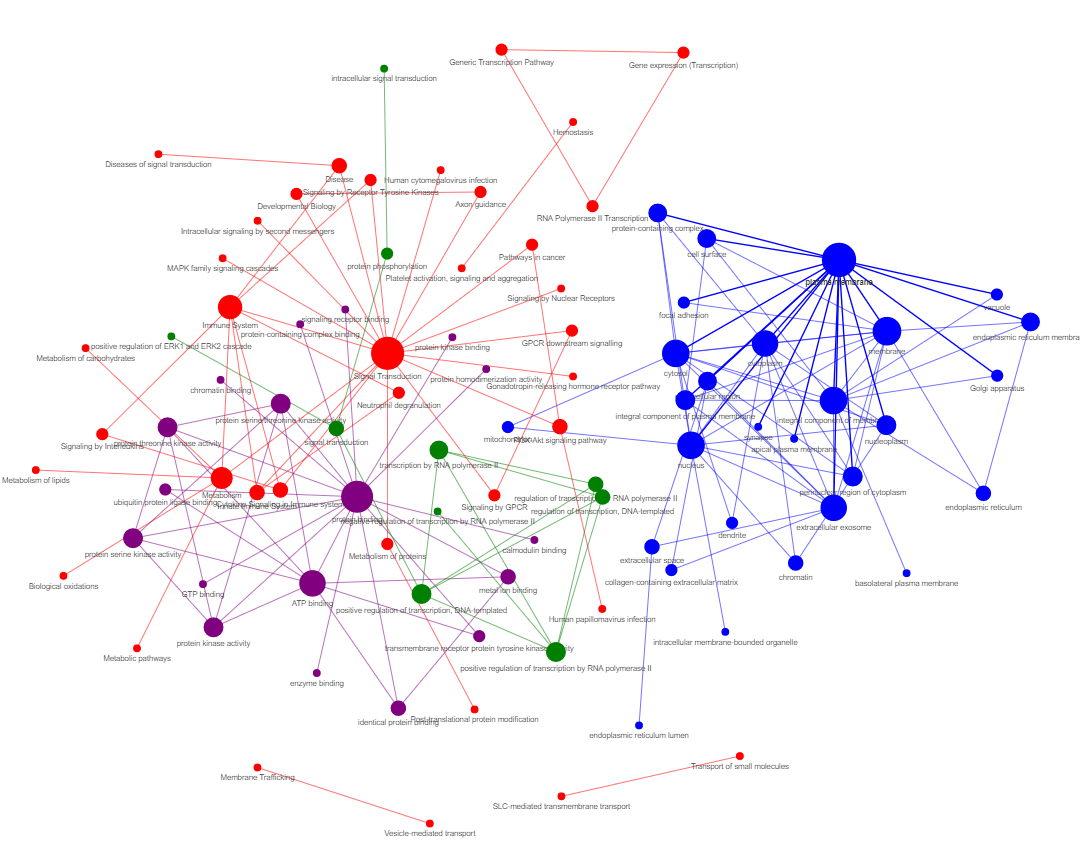
res4 = GEDSpy.GOPa.gopa_network(res2, p_val = 0.05, adj = 'BF', dir = 'results', name = 'GOPa_network')
- p_val - lower threshold for significant p-value. Default: 0.05
- adj - ['BF'] Bonferroni adjusted of p-value or ['None'] lack of adjusting. Default: 'None'
- dir - graph saveing place. Default:
CWD/results - name - graph name. Default: 'GOPa_network'
zinc_gene_list = list(res3['Gen1']) + list(res3['Gen2'])
- It is example of potetntial gene list. There can be use any set of genes
res5 = GEDSpy.zinc.zinc_drug(zinc_gene_list, zinc_type = 'all', species = 'all')
- zinc_gene_list - list of analyzed genes
- zinc_type - type of substances from ZINC db: ['all'] | ['observations'] | ['substances'] | ['purchasable']. Default: 'all'
- species - ['ms'] mouse | ['hs'] homo sapiens | ['all'] both species. Default: 'all'
res6 = GEDSpy.zinc.zinc_plot(res5, p_val = 0.05, adj = 'None', dir = 'results', name = 'drugs')
- p_val - lower threshold for significant p-value. Default: 0.05
- adj - ['BF'] Bonferroni adjusted of p-value or ['None'] lack of adjusting. Default: 'None'
- dir - graph saveing place. Default:
CWD/results - name - graph name. Default: 'drugs'
