| layout | title | category | tags | order | |||
|---|---|---|---|---|---|---|---|
section-summary |
Debugger |
debugger |
|
0 |
The Enso Debugger allows amongst other things, to execute arbitrary expressions in a given execution context - this is used to implement a debugging REPL. The REPL can be launched when triggering a breakpoint in the code.
This folder contains all documentation pertaining to the REPL and the debugger, which is broken up as follows:
- The Enso Debugger Protocol: The protocol for the Debugger
As a well written citizen of the GraalVM project the Enso
language can be used with existing tools available for the overall platform. One
of them is
Chrome Debugger and Enso
language is fully integrated with it. Launch the bin/enso executable with
additional --inspect option and debug your Enso programs in Chrome Developer
Tools.
enso$ ./built-distribution/enso-engine-*/enso-*/bin/enso --inspect --run ./test/Tests/src/Data/Numbers_Spec.enso
Debugger listening on ws://127.0.0.1:9229/Wugyrg9
For help, see: https://www.graalvm.org/tools/chrome-debugger
E.g. in Chrome open: devtools://devtools/bundled/js_app.html?ws=127.0.0.1:9229/Wugyrg9
copy the printed URL into chrome browser and you should see:

Step in, step over, set breakpoints, watch values of the variables as well as
evaluate arbitrary expressions in the console. Note that as of December 2022,
with GraalVM 22.3.0, there is a well-known
bug in Truffle that causes
NullPointerException when a host object gets into the chrome inspector. There
is a workaround for that, but it may not work in certain situations. Therefore,
if you encounter NullPointerException thrown from
at org.graalvm.truffle/com.oracle.truffle.polyglot.PolyglotContextImpl.getContext(PolyglotContextImpl.java:685)
simply ignore it. It will be handled within the debugger and should not affect the rest of the environment.
Enso libraries are written in a mixture of Enso code and Java libraries. Debugging both sides (the Java as well as Enso code) is possible with a decent IDE.
Get NetBeans version 13 or newer or
VS Code with Apache Language Server extension
and just pass in special JVM arguments when launching the bin/enso launcher:
enso$ JAVA_OPTS=-agentlib:jdwp=transport=dt_socket,server=y,address=8000 ./built-distribution/enso-engine-*/enso-*/bin/enso --run ./test/Tests/src/Data/Numbers_Spec.enso
Listening for transport dt_socket at address: 8000
and then Debug/Attach Debugger. Once connected suspend the execution and (if the Enso language has already been started) choose the Toggle Pause in GraalVM Script button in the toolbar:
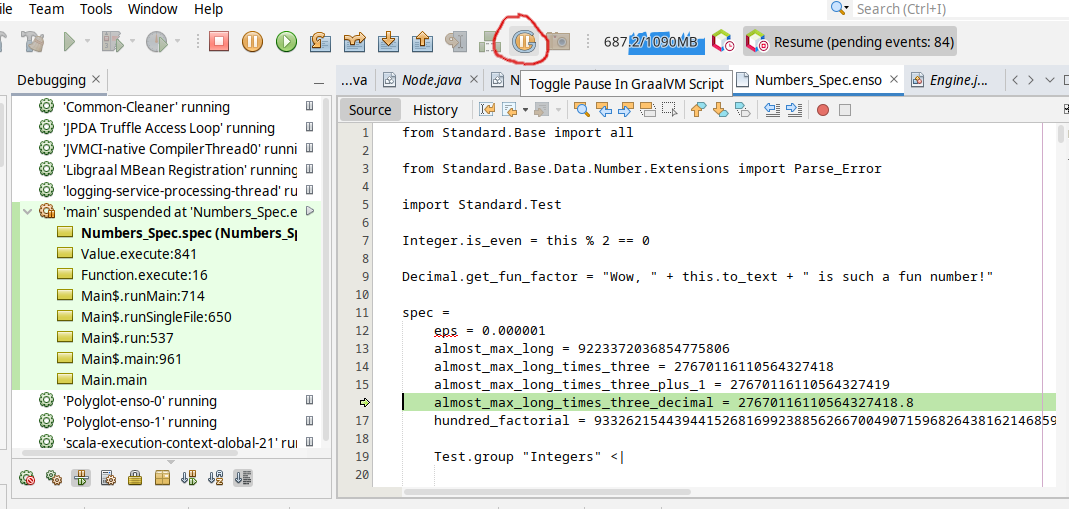
and your execution shall stop on the next .enso line of code. This mode allows
to debug both - the Enso code as well as Java code. The stack traces shows a
mixture of Java and Enso stack frames by default. Right-clicking on the thread
allows one to switch to plain Java view (with a way more stack frames) and back.
Analyzing low level details as well as Enso developer point of view shall be
simple with such tool.