Display both absolute frequencies and percentages #89
Conversation
…e of

  the total for each intersection and category.
Refactored the string formatting using .format() instead of %
|
Thanks for the pull request. @arosenfeld addressees the same issue in #77. Unfortunately I've not found the time and focus to touch that up and merge it. There were some tricky questions of consistency there. I would appreciate if you took a look at that pull request and compare how it handles this matter. |
|
Thanks for the quick response. I have looked into issue #77 and I like the idea of adding a new parameter. I think show_counts and show_percents should not affect each other. What I mean is we can still keep the flexibility of the current show_counts implementation and display percentages on top of it. import upsetplot
example = upsetplot.generate_counts()
plot(example, show_counts=False, show_percents=False)
Percentages can be displayed even with no counts: plot(example, show_counts=False, show_percents=True)
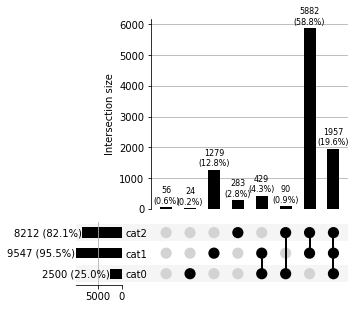
When counts and percentages are displayed, percentages are in a new line below: plot(example, show_counts=True, show_percents=True)
This strategy keeps the current formatting functionality of show_counts, with or without displaying percentages: plot(example, show_counts='%.2f', show_percents=True)
The change only affects the label generation, adding the new parameter and doesn't break any existing implementation. |


|
Sorry I've been relatively short of time lately or I would probably have
tweaked and merged @arosenfeld's PR months ago. I hope I can get to this
over March.
|
|
Hi @maziello, I've tried to refactor this and add some tests. WDYT? |
|
Hi @arosenfeld, in the end i'm inclining to adopt this version. Let me know your thoughts. |
|
Hi @jnothman, it looks great. Go for it! |
|
Thank you @maziello and @arosenfeld! |
Closes #77
Added option to display both the absolute frequency and the percentage of the total for each intersection and category.
Refactored the string formatting using .format() instead of %