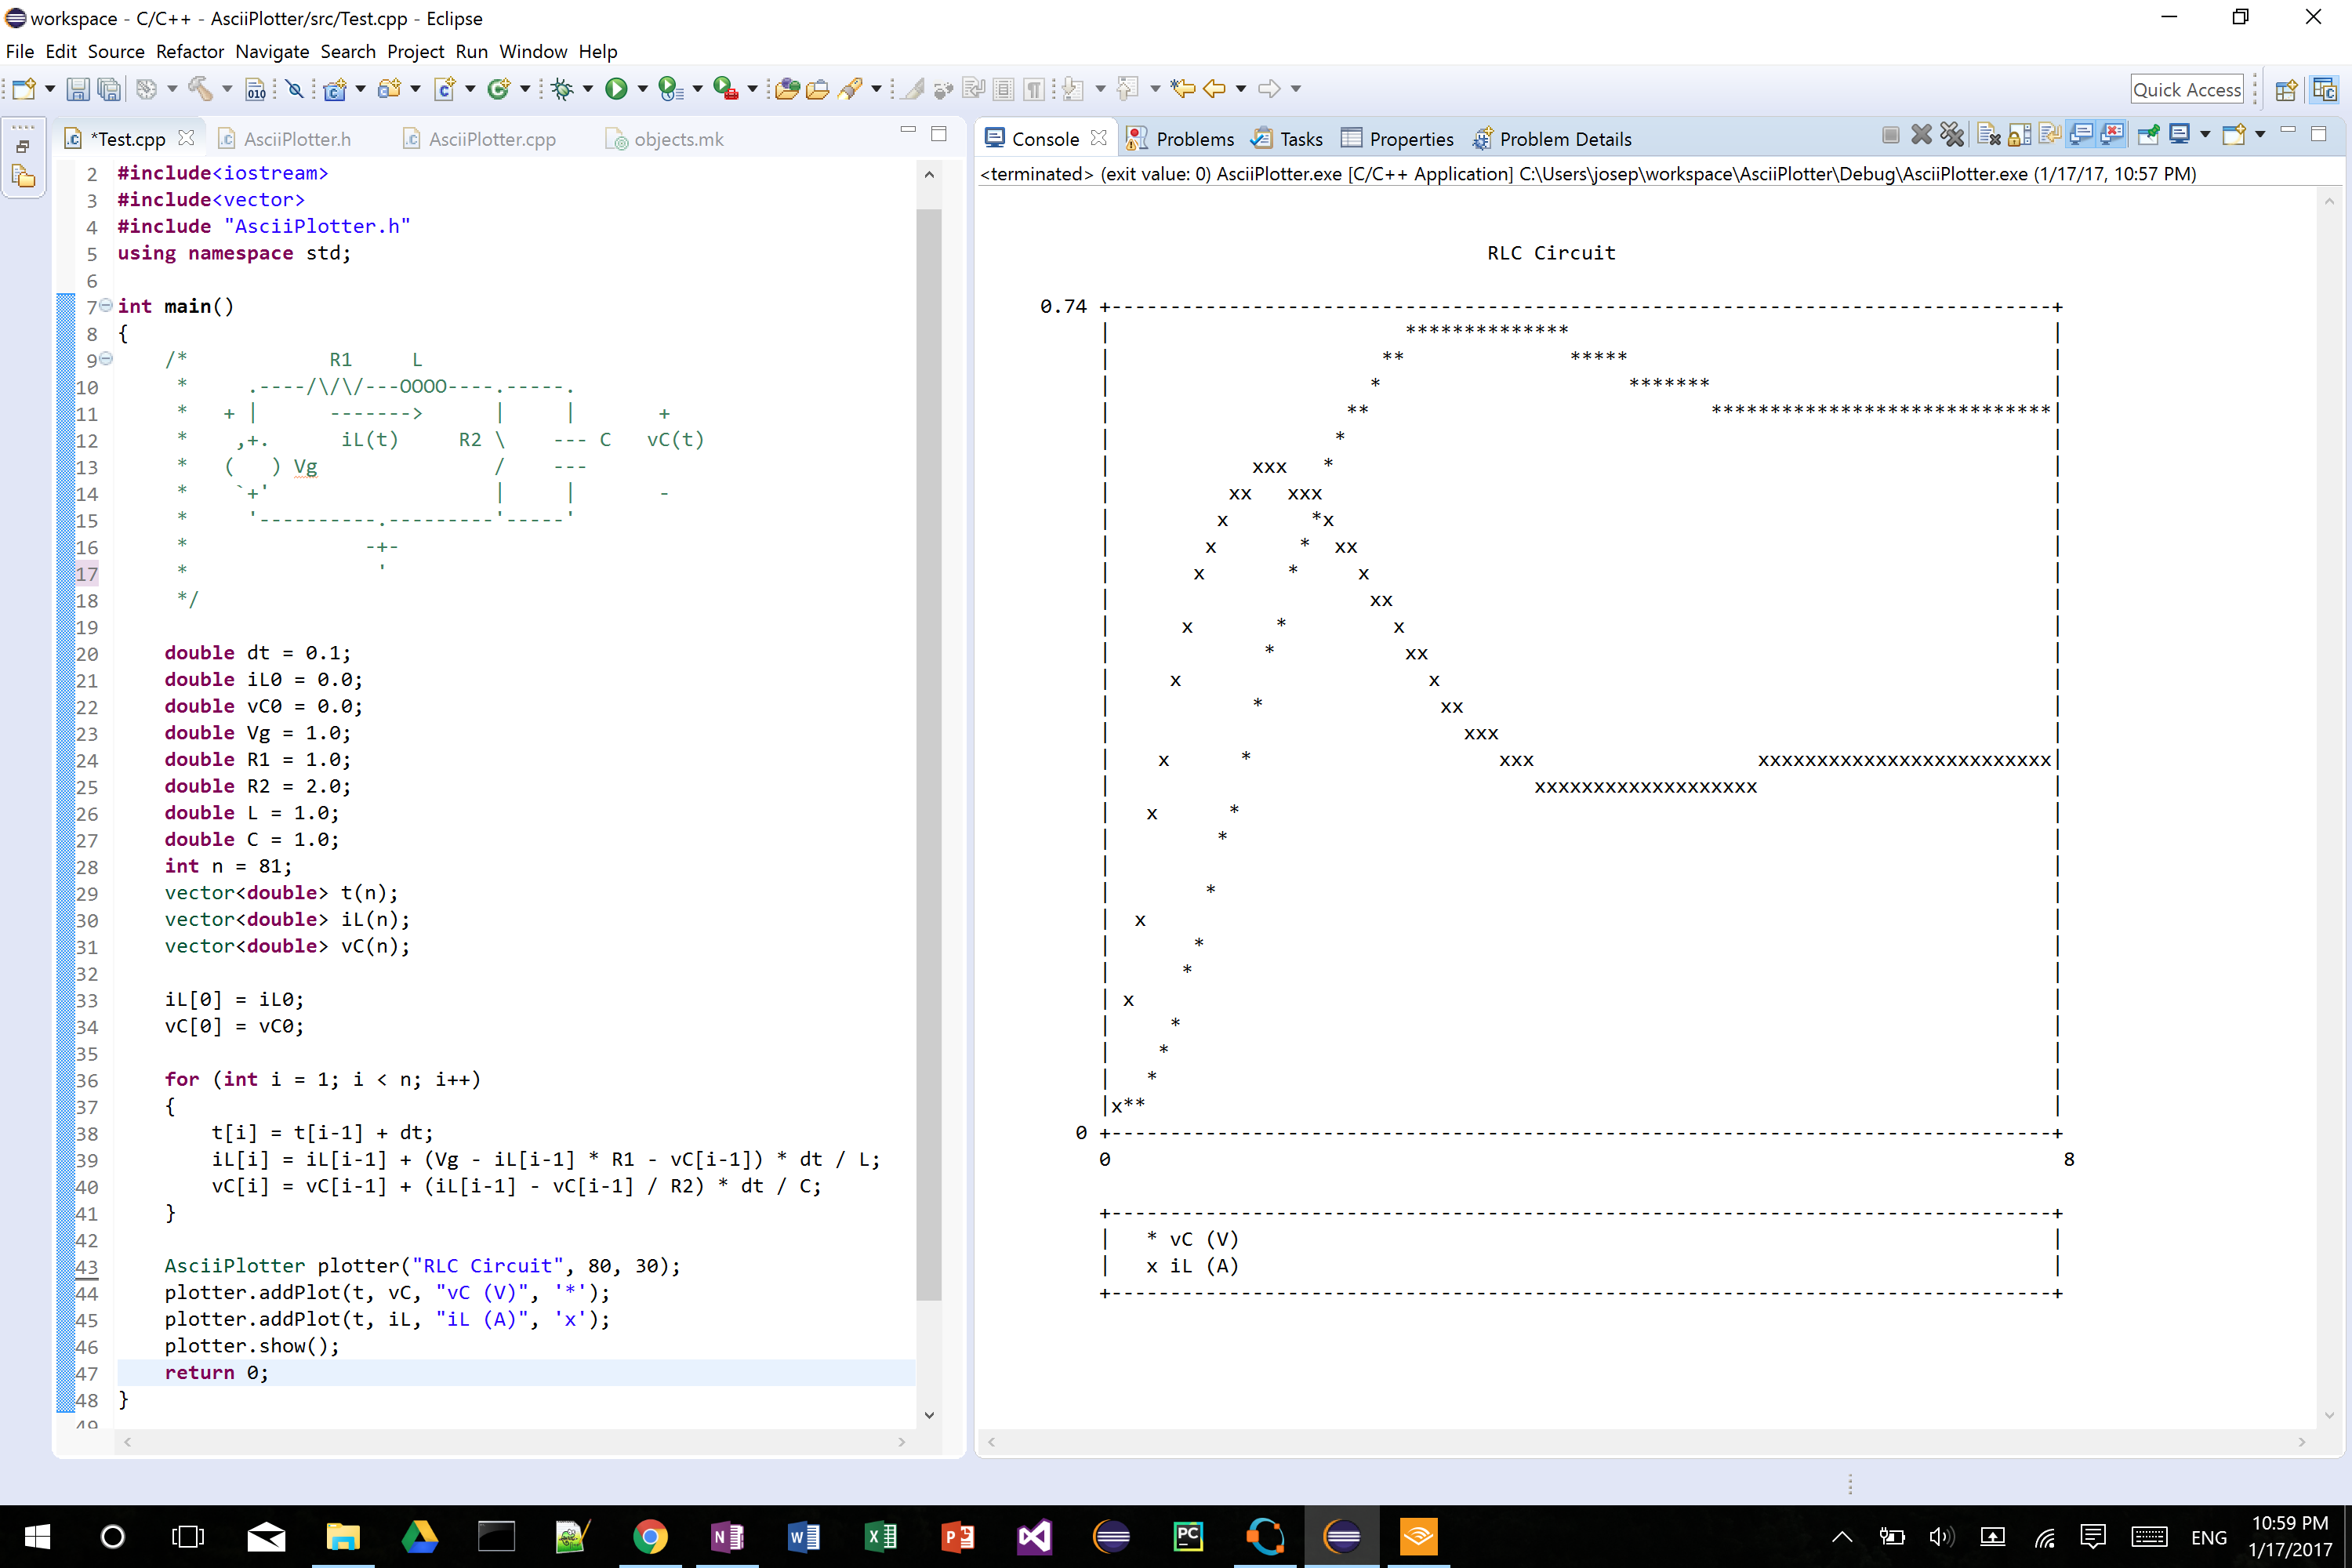
Quick-n-dirty scientific plotting in the c++ console
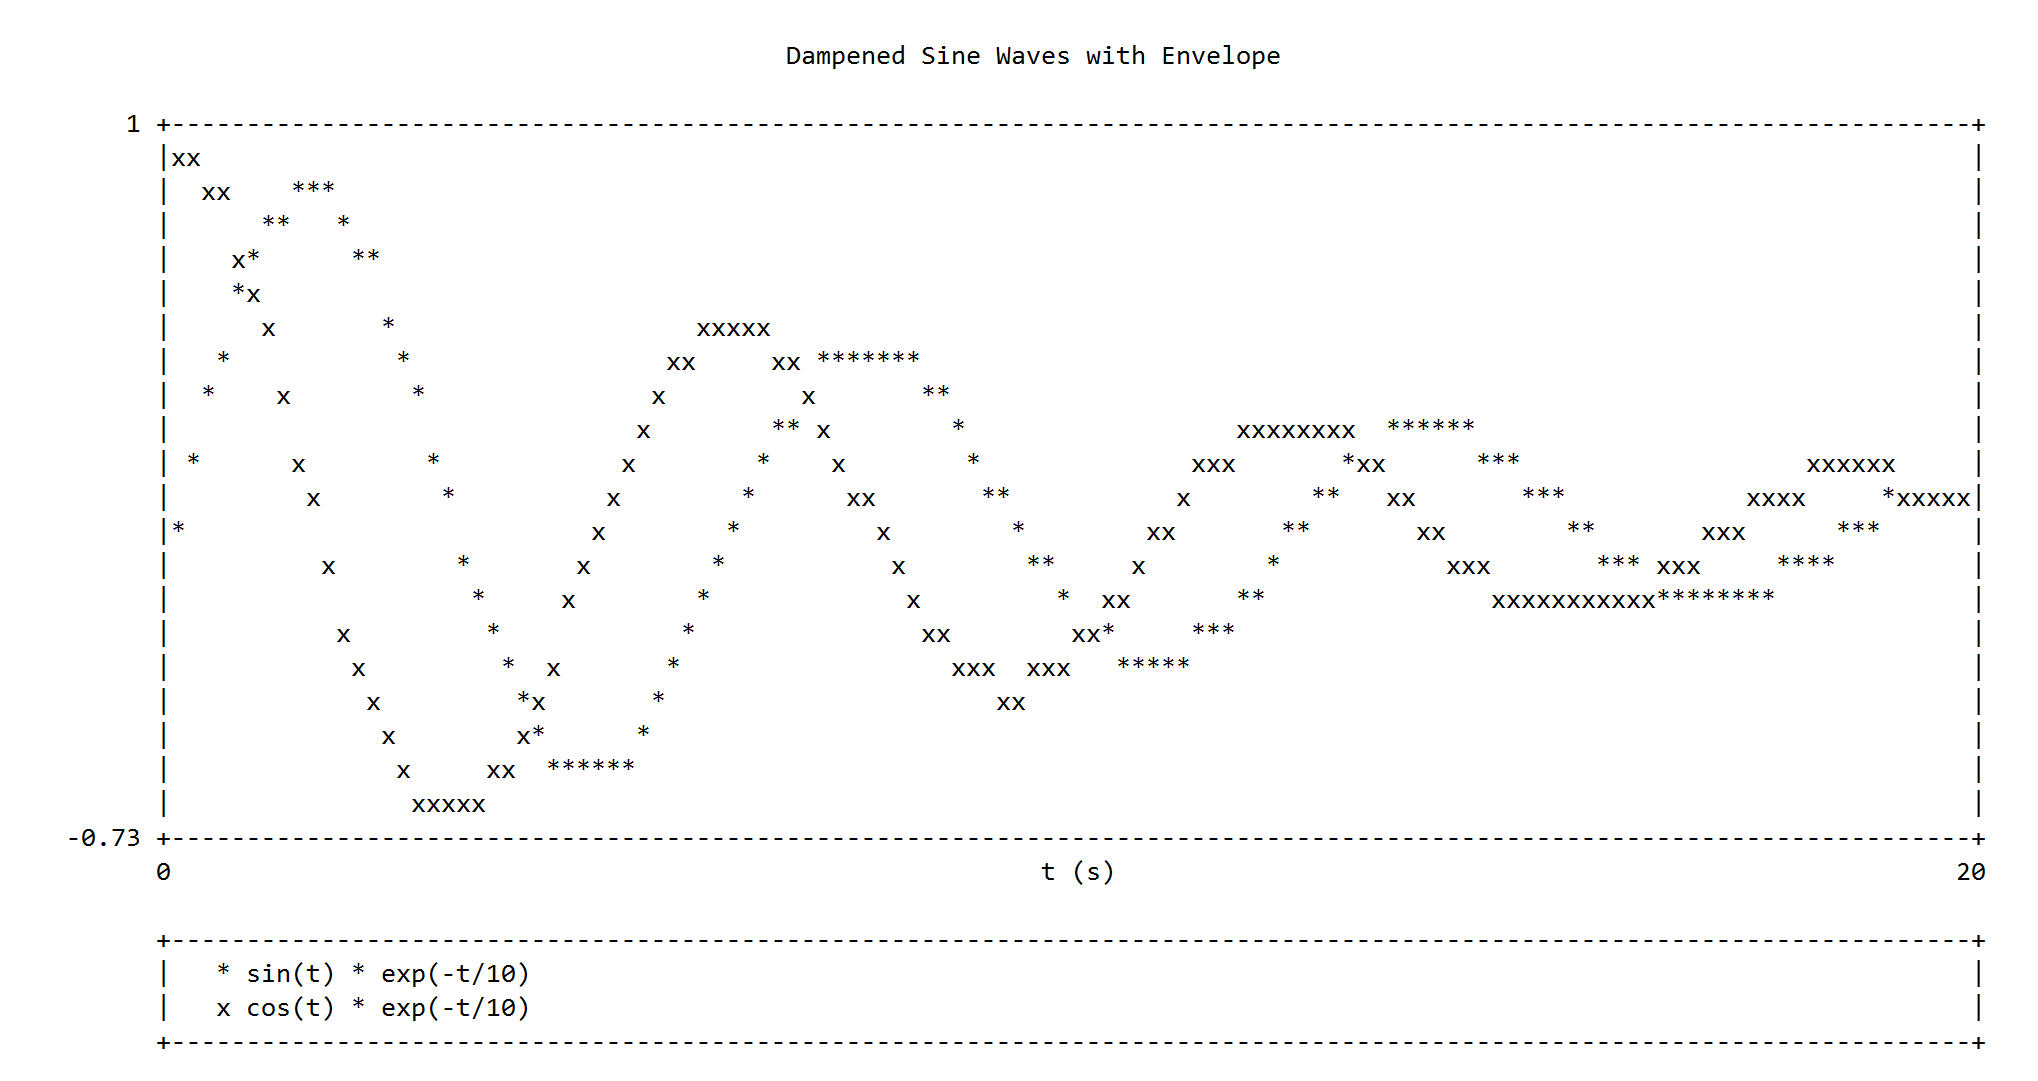
AsciiPlotter plotter("Damped Sine Waves", 120, 20);
vector<double> t(101);
vector<double> x1(101);
vector<double> x2(101);
double dt = 0.2;

for (int i = 0; i < 101; i++){
  if (i != 0){
    t[i] = t[i - 1] + dt;
  }
  x1[i] = sin(t[i]) * exp(-t[i]/10);
  x2[i] = cos(t[i]) * exp(-t[i]/10);
}

plotter.addPlot(t, x1, "sin(t) * exp(-t/10)", '*');
plotter.addPlot(t, x2, "cos(t) * exp(-t/10)", 'x');
plotter.legend();
plotter.xlabel("t (s)");
plotter.show();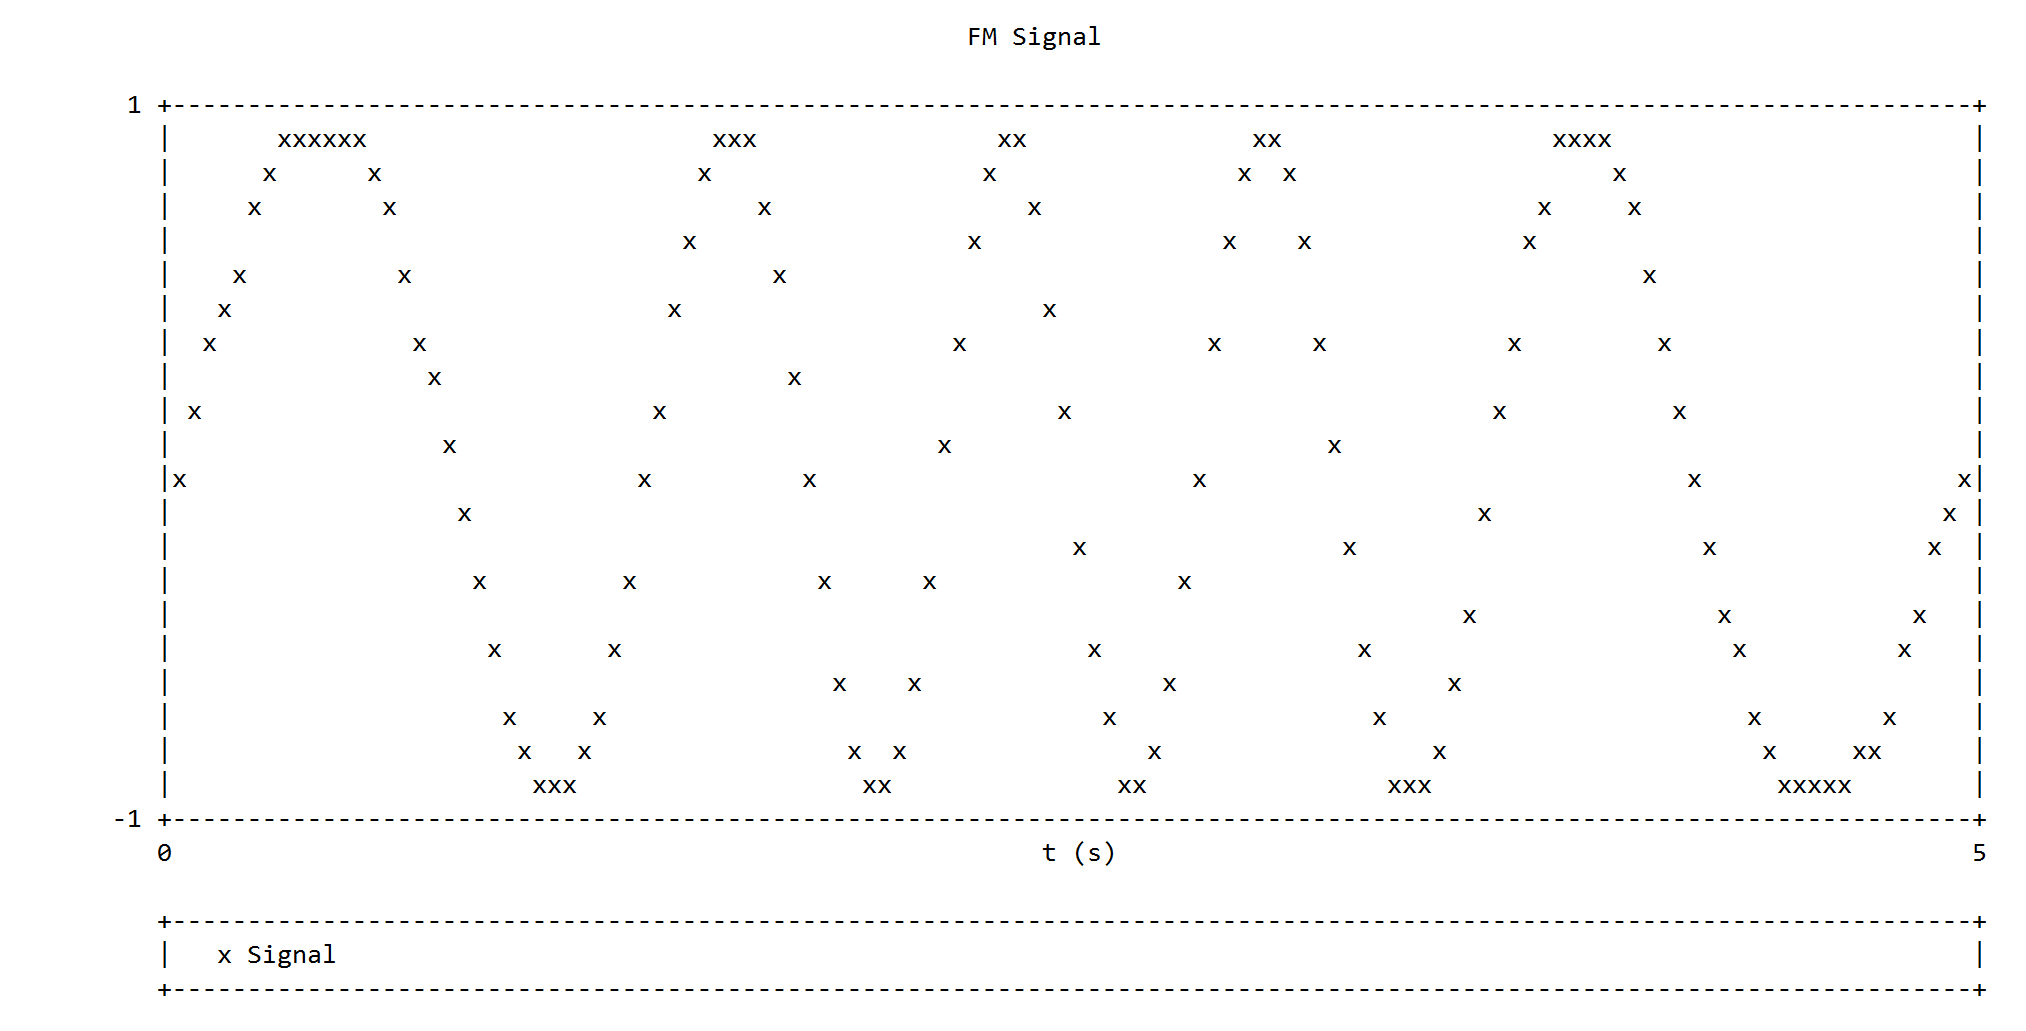
AsciiPlotter plotter("FM Signal", 120, 20);
vector<double> t(101);
vector<double> x(101);
double dt = 0.05;

for (int i = 0; i < 101; i++){
  if (i != 0){
    t[i] = t[i - 1] + dt;
  }
  x[i] = sin(6.28 * t[i] - 2.0 * sin(6.28 * 0.2 * t[i]));
}

plotter.addPlot(t, x, "Signal", 'x');
plotter.legend();
plotter.xlabel("t (s)");
plotter.show();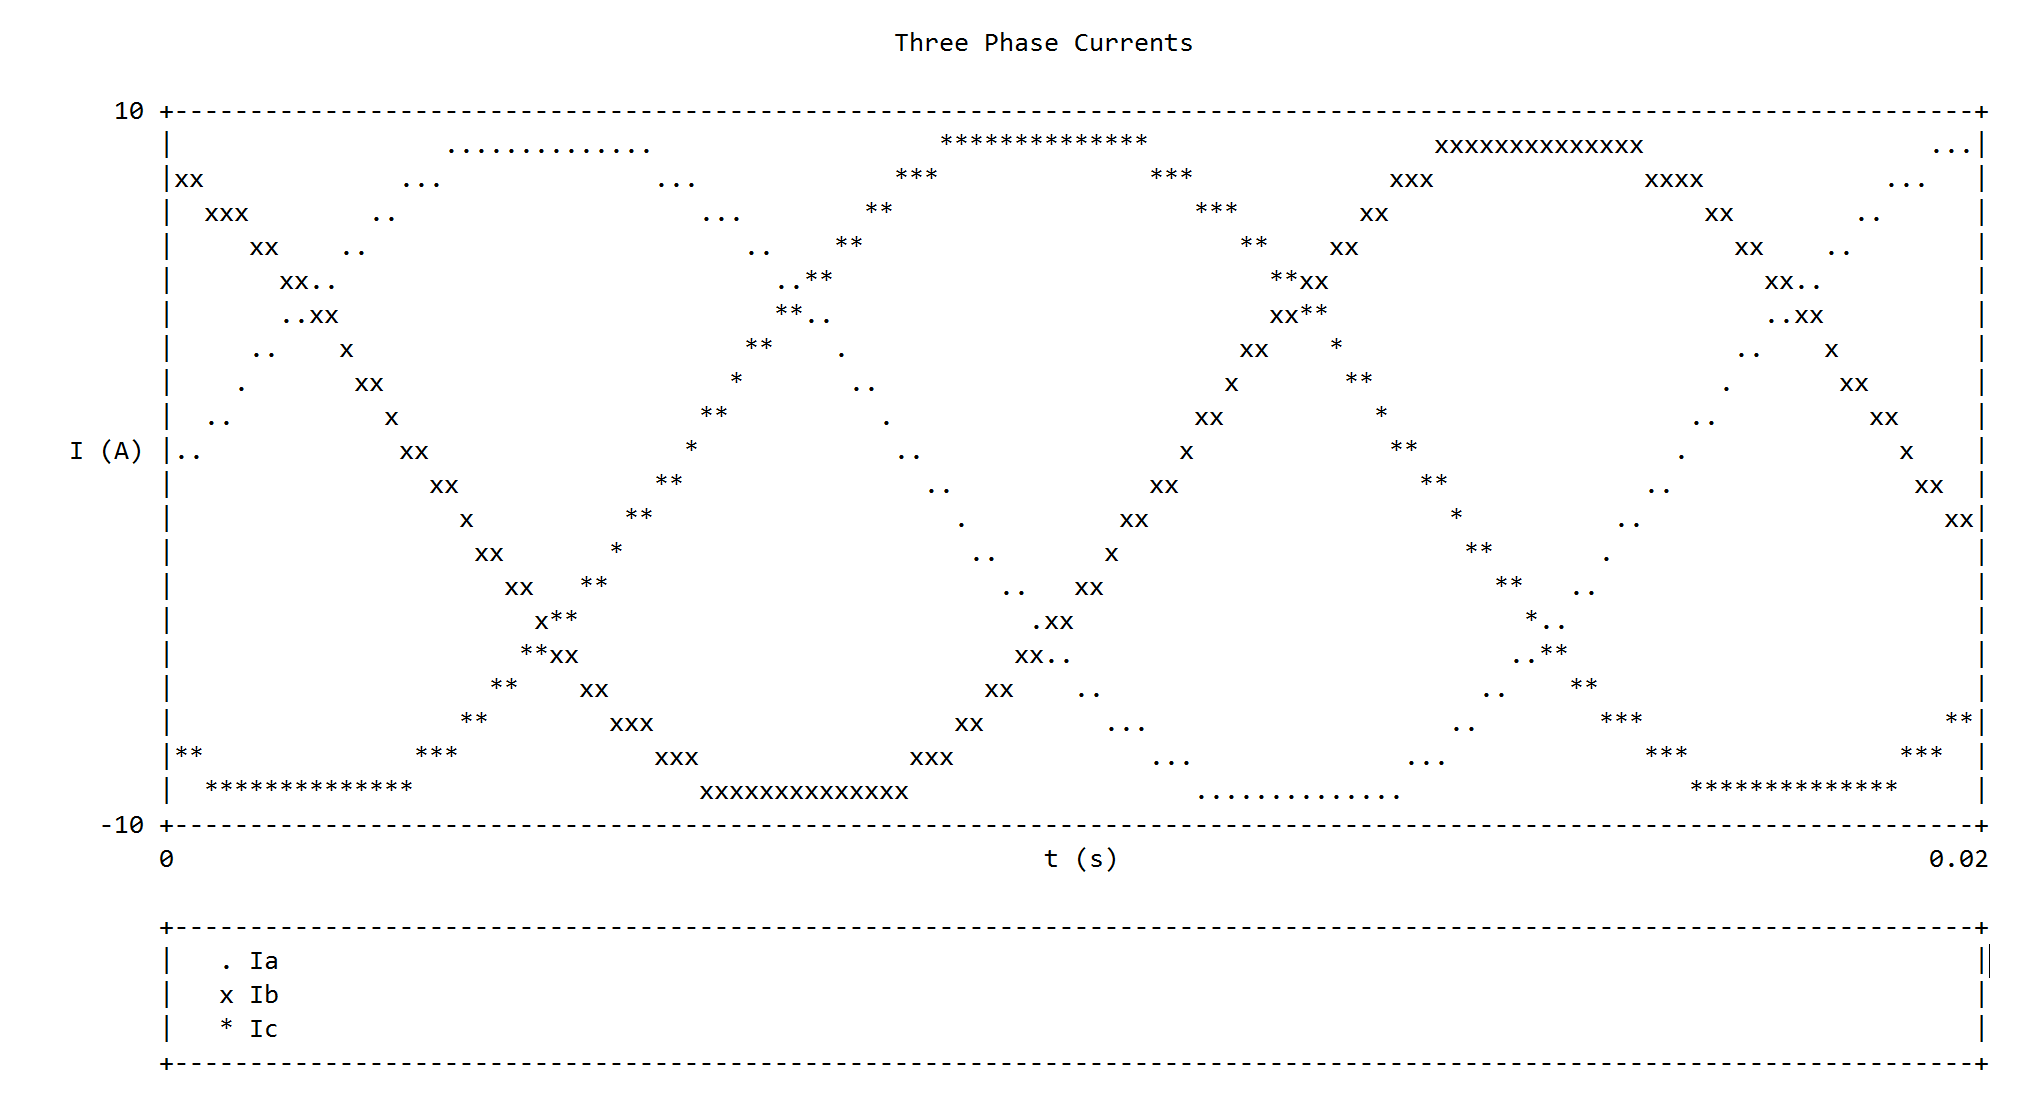
AsciiPlotter plotter("Three Phase Currents", 120, 20);
vector<double> t(101);
vector<double> a(101);
vector<double> b(101);
vector<double> c(101);
double dt = 0.0002;

for (int i = 0; i < 101; i++){
  if (i != 0){
    t[i] = t[i - 1] + dt;
  }
  a[i] = 10.0 * sin(6.28 * 60.0 * t[i]);
  b[i] = 10.0 * sin(6.28 * 60.0 * t[i] + 2.09);
  c[i] = 10.0 * sin(6.28 * 60.0 * t[i] + 4.19);
}

plotter.addPlot(t, a, "Ia", '.');
plotter.addPlot(t, b, "Ib", 'x');
plotter.addPlot(t, c, "Ic", '*');

plotter.legend();
plotter.xlabel("t (s)");
plotter.ylabel("I (A)");
plotter.show();