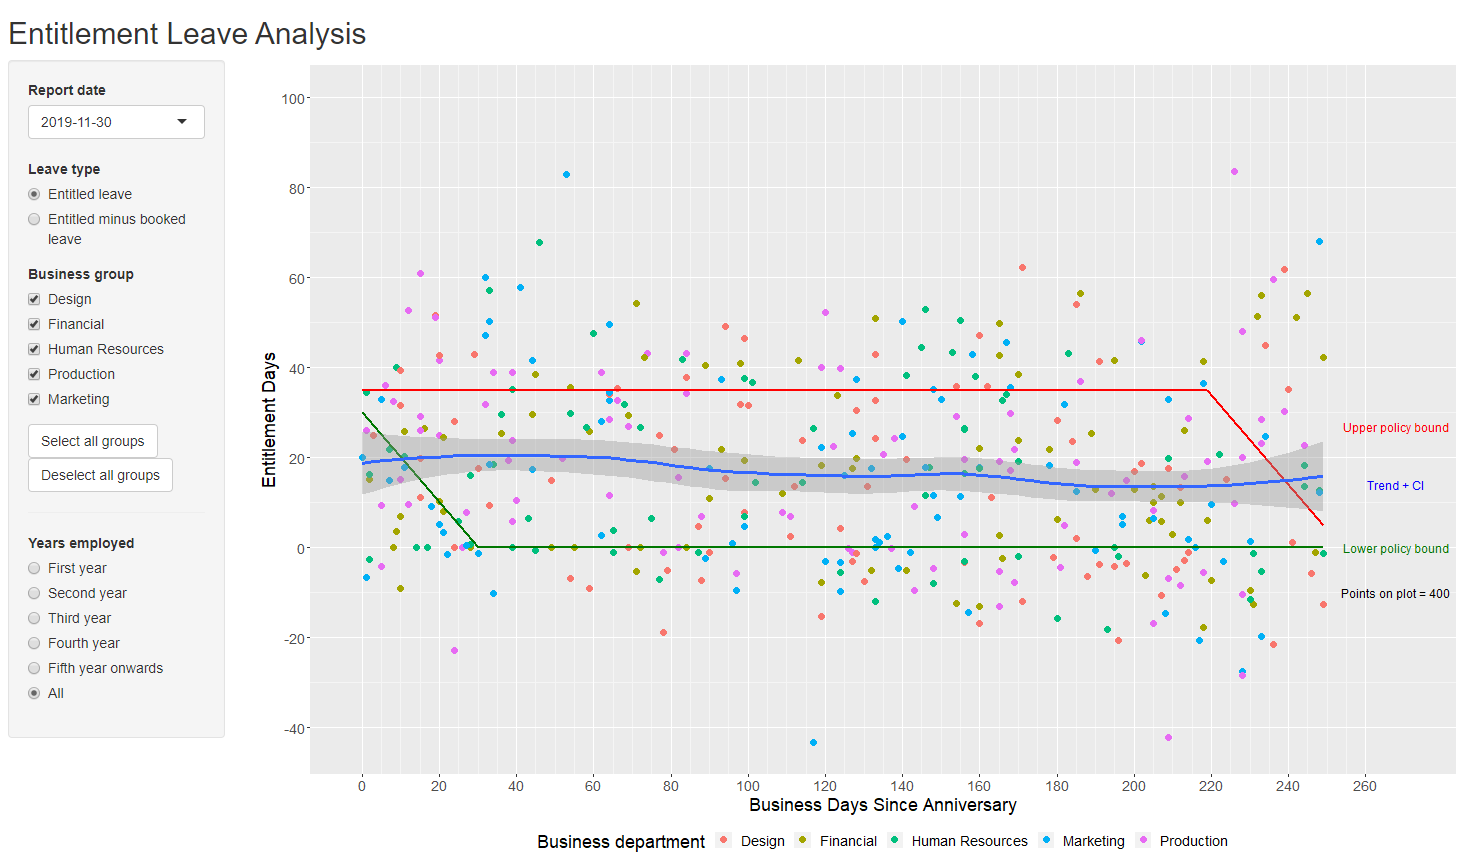 My first professional project uses R and Shiny to visualise leave entitlement for each employee in a business and the business' policy. Leave entitlement is a liability for a business as a promise to its employees. The visualisation can be manipulated to only show certain business departments, employees of certain seniority, and per report date. Future booked leave can also be taken into account.
All data is generated randomly every time it is open, and hence the assumptions for this particular scenario are:
- Those employed less than a year do not have entitled leave, as entitlement is only granted on the anniversary of their employment
- 30 entitlement days are granted every anniversary, "BASELINE_DAYS"
- Business policy only allows employees to carry over 5 entitlement days each year, "MIN_DAYS"
- Compliance around these policies is not necessarily enforced
- Employees draw down these entitlement days over the course of their employment year
- Business has 5 generically named departments
- Can't take leave on non-business days, hence all calculations and visualisations use business days only
- Business follows the Wellington, NZ holiday calendar (calendars have been created for Auckland and Christchurch regional holidays)
Ensure these libraries are installed and up-to-date (older versions were buggy for me):
- shiny
- bizdays
- tidyverse
- lubridate
- grid
Run this on the R console to install them all at once:
install.packages(c("shiny", "bizdays", "tidyverse", "lubridate", "grid"))
Then run this:
runGitHub("LeaveViz", "johnielb")
Connect to a source that has the following data:
- "ReportDate" the date these data are true for
- "EmployeeStartDate"
- "BusinessGroup" department employee belongs to
- "FutureBookedLeave" leave organised in future with employee's manager
I used a csv file, connected using the read.csv() function.