Data analysis and visualization of open BIXI data during the 2021 season. Analysis executed with Python (pandas), visualization done in ArcGIS and MapBox.
Data was sourced from the BIXI public website, then cleaned and merged to 2021.csv.
Total scope of data:1
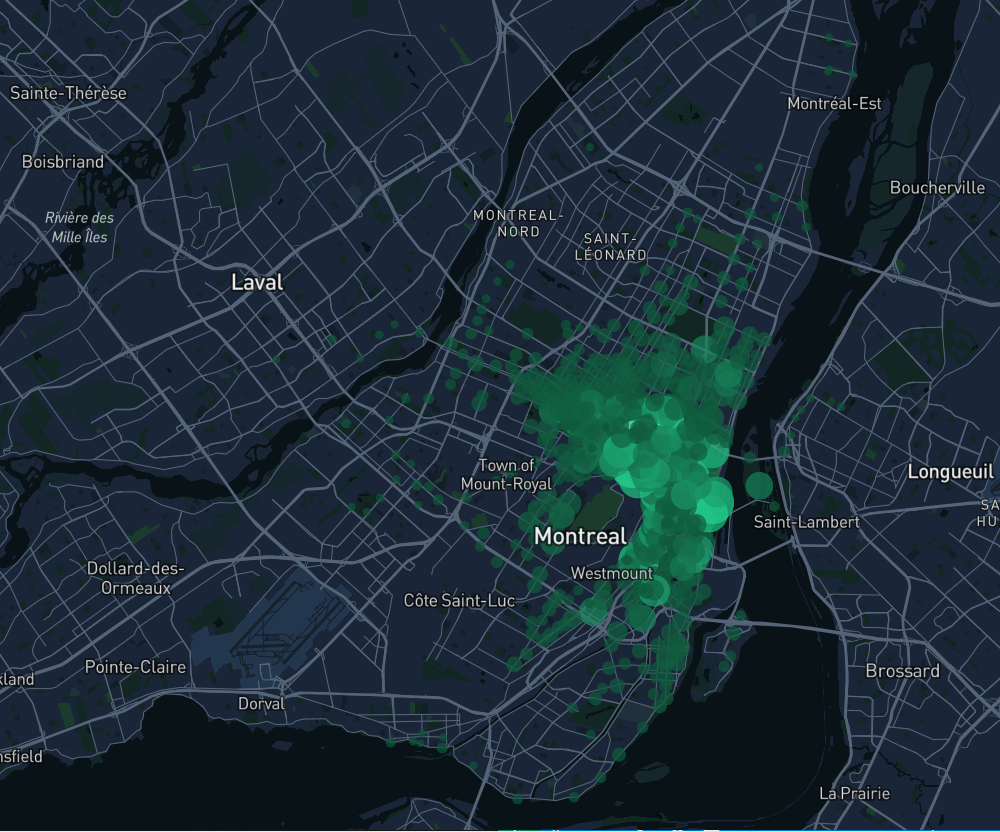 Zoomed in view of most popular BIXI stations:

Footnotes
-
Size and shade of symbology is directly proportional to total amount of trips started and ended at each station from April-August 2021. ↩