enplot: a one-line plot command
enplot use python and matplotlib to provide a simple command-line interface that be used to quickly plot data in CSV and related formats. The focus of enplot is not publication quality plots, but rather quick and easy presentation of numerical data.
$ enplot --help
usage: enplot [-h] [-t TITLE] [-o OUTPUT_FILE] [-f OUTPUT_FORMAT] [-x X]
              [-y Y] [-z Z] [-m] [-T] [-X X_LABEL] [-Y Y_LABEL] [-Z Z_LABEL]
              [-C C] [--log-x] [--log-y] [-H HEADER]
              [-l LEGENDS] [-S] [-s STYLE] [-q] [-d] [-v VIEW] [-V] [-c]
              [datafile [datafile ...]]

positional arguments:
  datafile              a data file in a CSV-like format

optional arguments:
  -h, --help            show this help message and exit
  -t TITLE, --title TITLE
                        plot title
  -o OUTPUT_FILE, --output-file OUTPUT_FILE
                        file name for output
  -f OUTPUT_FORMAT, --output-format OUTPUT_FORMAT
                        file format for output
  -x X                  column index in the data file for use as X variable
  -y Y                  comma-separated list of column index in the data file
                        for use as Y variables
  -z Z                  comma-separated list of column index in the data file
                        for use as Y variables
  -C C                  column index in the data file for use as color code
  --log-x               plot using log of the values in x-axis
  --log-y               plot using log of the values in y-axis
  -H HEADER, --header HEADER
                        Number of header lines to ignore
  -m, --matrix-form     data in matrix form
  -T, --matrix-transpose
                        transpose data in matrix form
  -X X_LABEL, --x-label X_LABEL
                        label for use on X axis
  -Y Y_LABEL, --y-label Y_LABEL
                        label for use on Y axis
  -Z Z_LABEL, --z-label Z_LABEL
                        label for use on Z axis
  -l LEGENDS, --legends LEGENDS
                        comma-separated list of legends
  -S, --sort            sort the data by the X-axis data points
  -s STYLE, --style STYLE
                        graph style ('line', 'bar', 'scatter')
  -q, --quiet           do not display plot window
  -d, --debug           activate debug printouts
  -v VIEW, --view VIEW  view perspective (top or 3d)
  -V, --version         show version information
  -c, --colorbar        Show colorbar
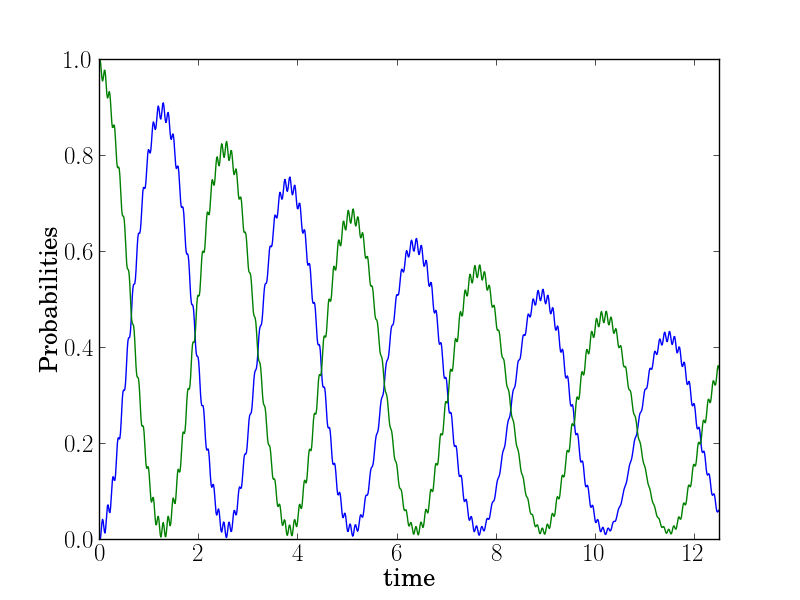
Plot lines corresponding to column data:
$ head -n 4 tests/example-data0.dat
# Generated by QuTiP: 1000x3 real matrix in decimal format [',' separated values].
0.0000000000,0.0000000000,1.0000000000
0.0125125125,0.0217573882,0.9773997992
0.0250250250,0.0747018995,0.9246287209

$ enplot -x 0 -y 1,2 -X "time" -Y "Probabilities" -o tests/example-data0.png tests/example-data0.dat
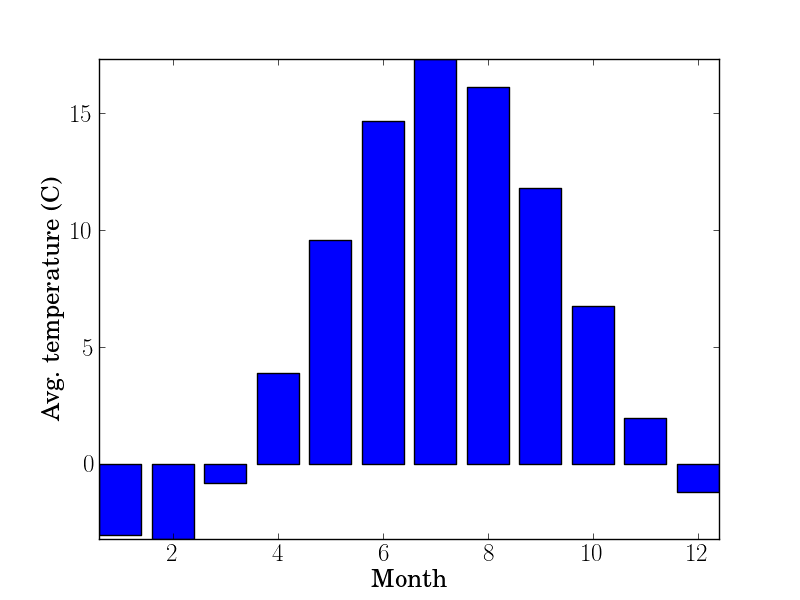
Plot bars corresponding to column data:
$ head -n 4 tests/example-data3.dat
1 -3.04
2 -3.21
3 -0.83
4 3.89
$ enplot -s bar -x 0 -y 1 -X "Month" -Y "Avg. temperature (C)" -o tests/example-data3.png tests/example-data3.dat
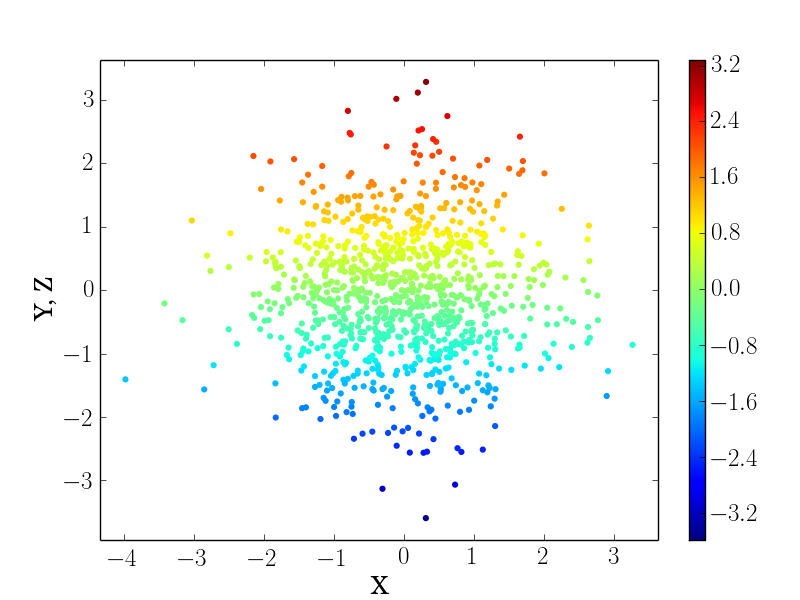
Scatter corresponding to column data:
$ enplot -s scatter -x 0 -y 1,2 -X "X" -Y "Y, Z" -o tests/example-data4.png tests/example-data4.dat
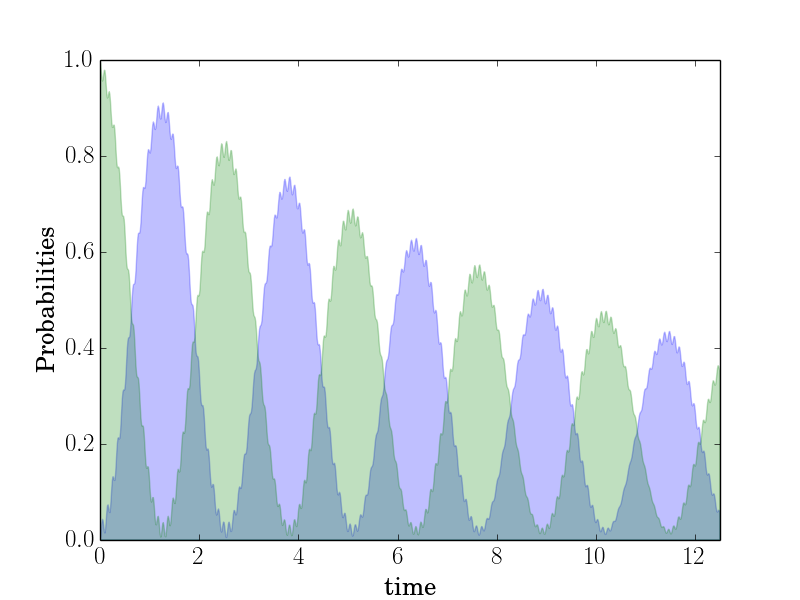
Plot filled areas corresponding to column data:
$ enplot -s fill -x 0 -y 1,2 -X "time" -Y "Probabilities" -o tests/example-data0b.png tests/example-data0.dat
$ enplot -x 0 -y 1 -z 2 -c -v 3d -o tests/example-data1a.png tests/example-data1.dat

$ enplot -x 0 -y 1 -z 2 -c -o tests/example-data1b.png tests/example-data1.dat

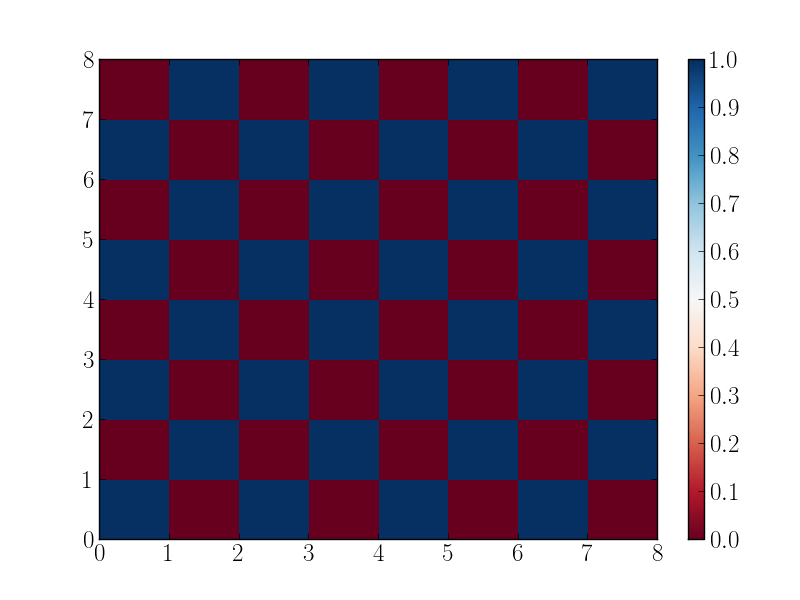
$ head -3 tests/example-data2.dat
1 0 1 0 1 0 1 0
0 1 0 1 0 1 0 1
1 0 1 0 1 0 1 0

$ enplot -m -c -o tests/example-data2.png tests/example-data2.dat