We read every piece of feedback, and take your input very seriously.
To see all available qualifiers, see our documentation.
Have a question about this project? Sign up for a free GitHub account to open an issue and contact its maintainers and the community.
By clicking “Sign up for GitHub”, you agree to our terms of service and privacy statement. We’ll occasionally send you account related emails.
Already on GitHub? Sign in to your account
write code about Venn diagram to draw the specific area with yellow. (Literarlly, we can represent the part as "A∩B-A")
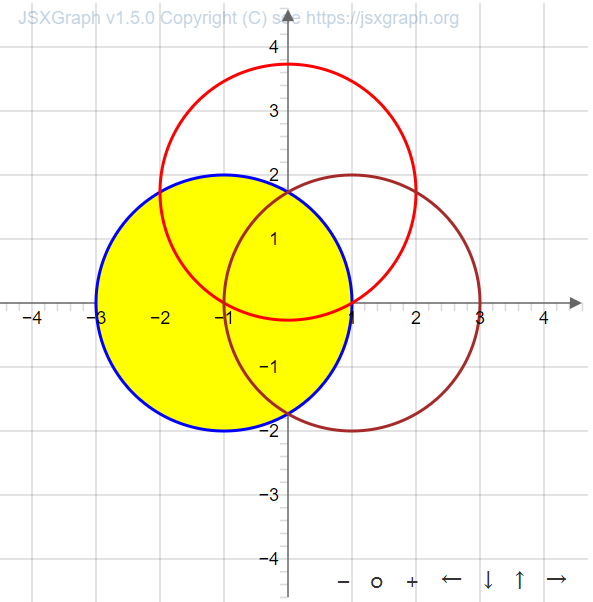
<!DOCTYPE html>
<html>
<head>
  <meta charset="UTF-8">
  <title>curvedifference Demo</title>
  <script type="text/javascript" src="https://jsxgraph.uni-bayreuth.de/distrib/jsxgraphcore.js"></script>
</head>
<body>
  <div id="jxgbox" style="width:400px;height:400px;"></div>
  <script type="text/javascript">
    var board = JXG.JSXGraph.initBoard('jxgbox', {boundingbox: [-3, 3, 3, -3], axis:true});


    var circle1 = board.create('circle', [[-1, 0], 2], {strokeWidth:2, strokeColor:'blue', fillOpacity:0.3});
    var circle2 = board.create('circle', [ [0, Math.sqrt(3)], 2], {strokeWidth:2, strokeColor:'red', fillOpacity:0.3});
    var circle3 = board.create('circle', [[1, 0], 2], {strokeWidth:2, strokeColor:'brown', fillOpacity:0.3});

    let temp = board.create("curveunion", [circle1,circle2],{
        fillColor: "blue",
        fillOpacity: 0
    } )

    board.create("curvedifference", [temp,circle1],{
        fillColor: "yellow",
        fillOpacity: 1
    } )
    board.update();
  </script>
</body>
</html>
Actual output:
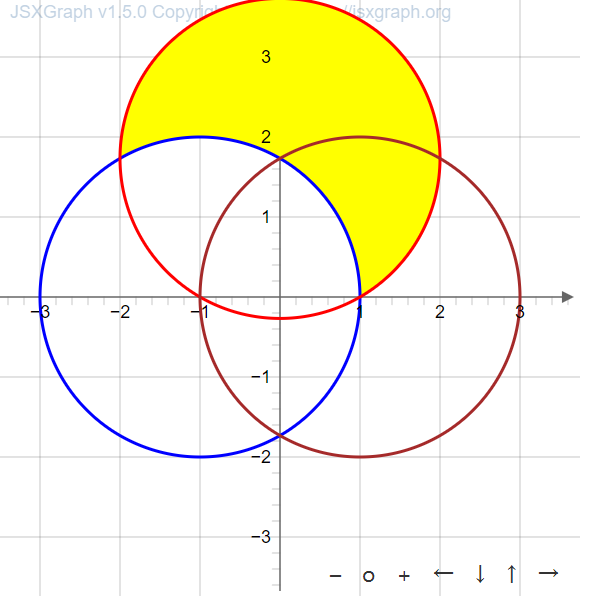
Expected output:
The text was updated successfully, but these errors were encountered:
No branches or pull requests
write code about Venn diagram to draw the specific area with yellow. (Literarlly, we can represent the part as "A∩B-A")
Actual output:
Expected output:
The text was updated successfully, but these errors were encountered: