Datasets
Content:
- Modelling domain
- Digital elevation model
- Flow direction and accumulation
- Soil data
- Groundwater table depth
- Land cover data
- Meteorologic forcings
-
Data to calibrate and validate models
-
Objective 1: Low-human impact watersheds
- Lake Erie domain including Lake St Clair
-
Objective 2: Watersheds draining into most downstream gauge stations
- Lake Erie domain including Lake St Clair
-
Objective 1: Low-human impact watersheds
We used the modelling domain of Lake Erie as specified by the Great Lakes Aquatic Habitat Framework (GLAHF). It the domain is shown in the figure below. It is a 103,666 km2 domain including the lake area and 76,352 km2 excluding all the water bodies.
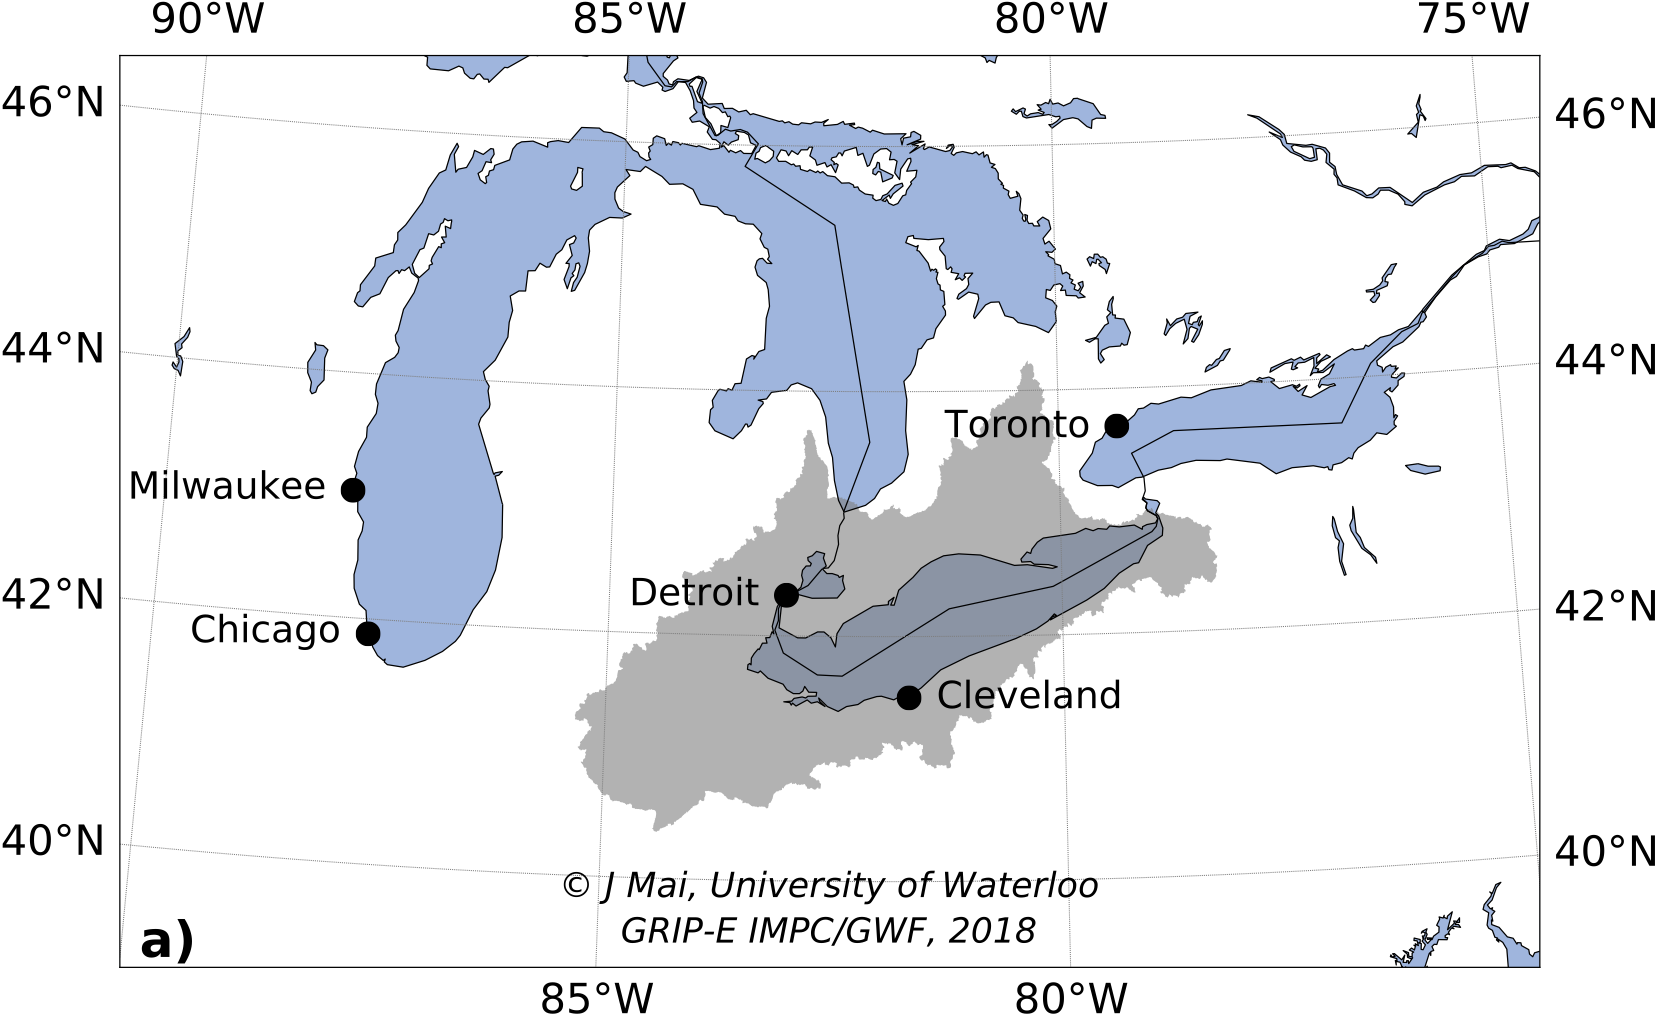
There are several shape files available for your convenience here.
- Shapefile of whole modeling domain (1 shape: land and lake together)
Lake Erie: data/shapefiles/1_LEB_boundary_mainland+lake.zip
- Shapefile of only land area (2 shapes: land split into US and Canadian portion)
Lake Erie: data/shapefiles/2_LEB_boundary_mainland_only.zip
- Shapefile of only lake area (1 shape: Lake Erie and St. Clair combined)
Lake Erie: data/shapefiles/3_LEB_boundary_lake_only.zip
- Shapefile of subwatersheds (621 shapes: 621 subwatersheds)
Lake Erie: data/shapefiles/4_LEB_boundary_subwatershed.zip

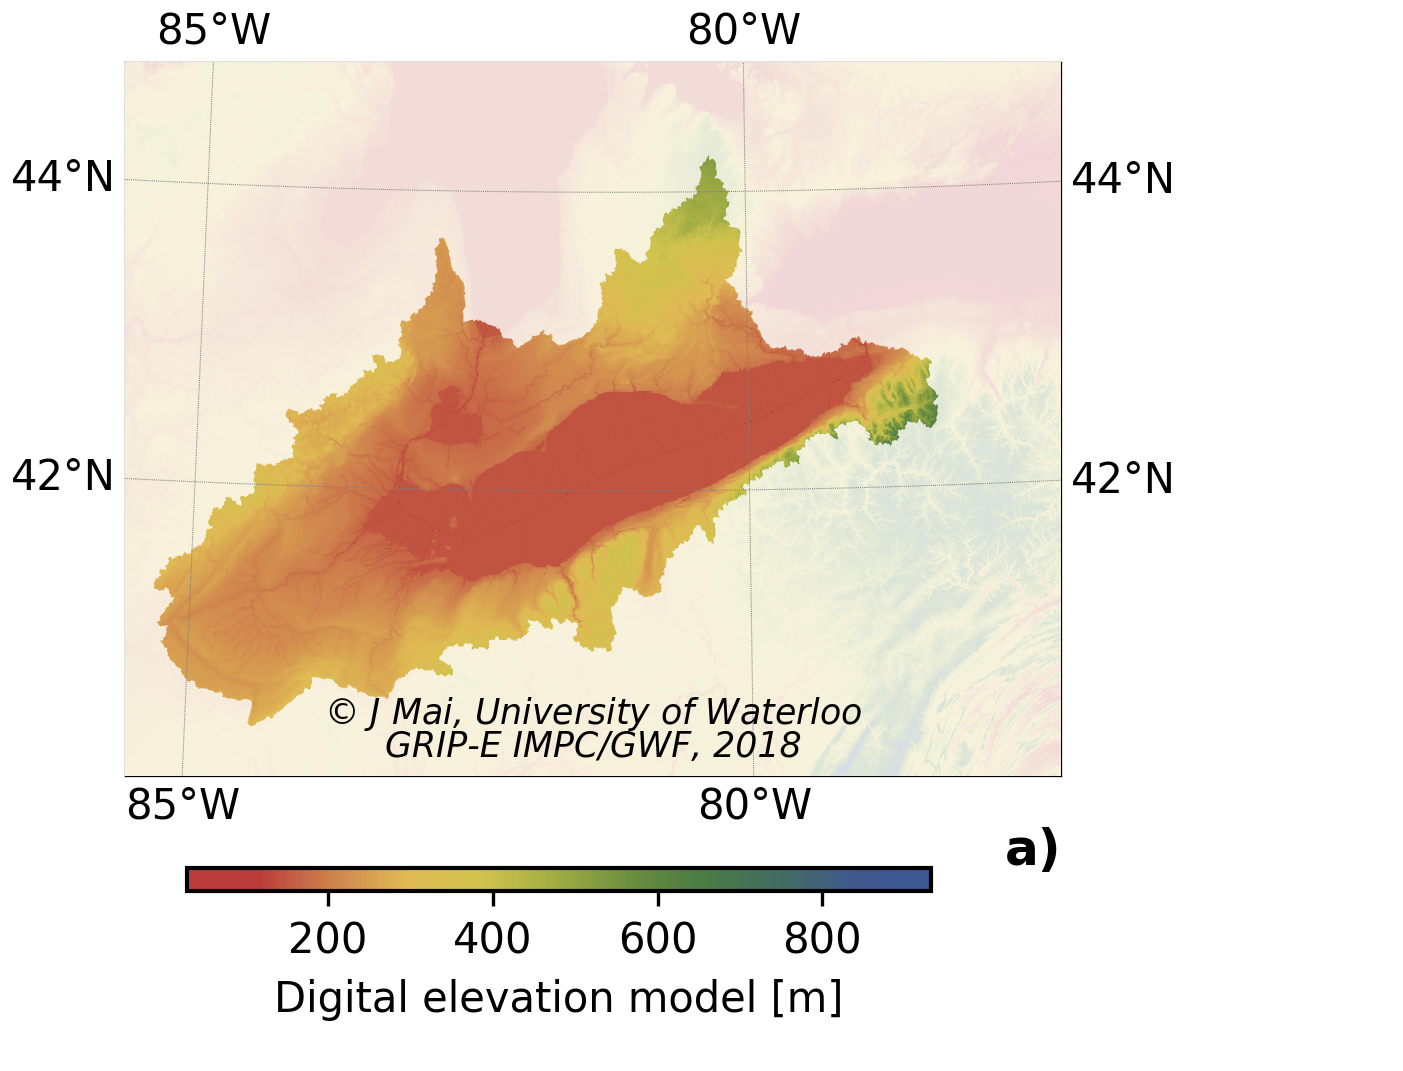
We used the conditioned SRTM Digital Elevation Model (DEM) from HydroSHEDS.
This dataset is used for all models for Phase 2 and onwards.
The HydroSHEDS DEM has a 3'' resolution which corresponds to about 90 m at the equator. The data can be downloaded here. A documentation can be found here. Data for the Lake Erie Basin are available on GitHub in Esri raster format and NetCDF on a regular lat-lon grid for the domain of latitudes between (40.00041580200195, 44.99958419799805) [degrees north] and longitudes between (-85.99958038330078,-77.00041961669922) [degrees east].
This dataset is used for VIC, VIC-GRU, HYPE, GR4J-lp, and GR4J-sd in Phase 0 and 1.
The HydroSHEDS DEM also has a 15'' resolution which corresponds to about 500 m at the equator. This dataset is upscaled hydrologically consistent from the 5'' dataset. Hence, they basically count as the same dataset at different resolutions. Data are available on GitHub in Esri raster format and NetCDF on a regular lat-lon grid for the domain of latitudes between (40.381248474121094, 44.23125076293945) [degrees north] and longitudes between (-85.32765197753906,-78.27348327636719) [degrees east].
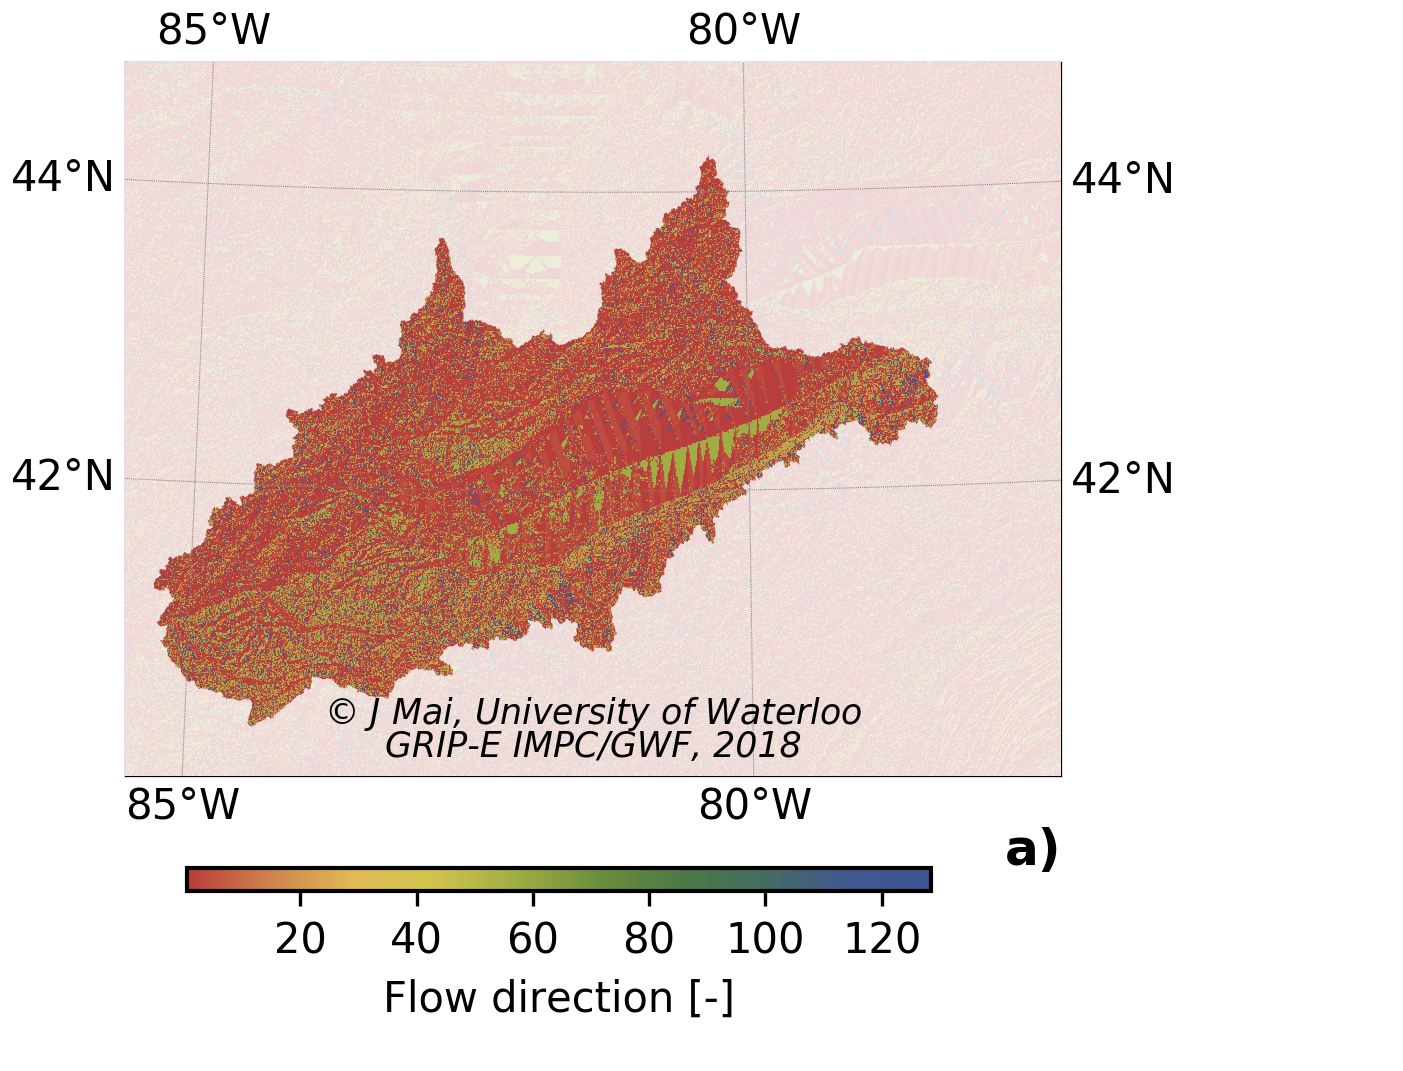
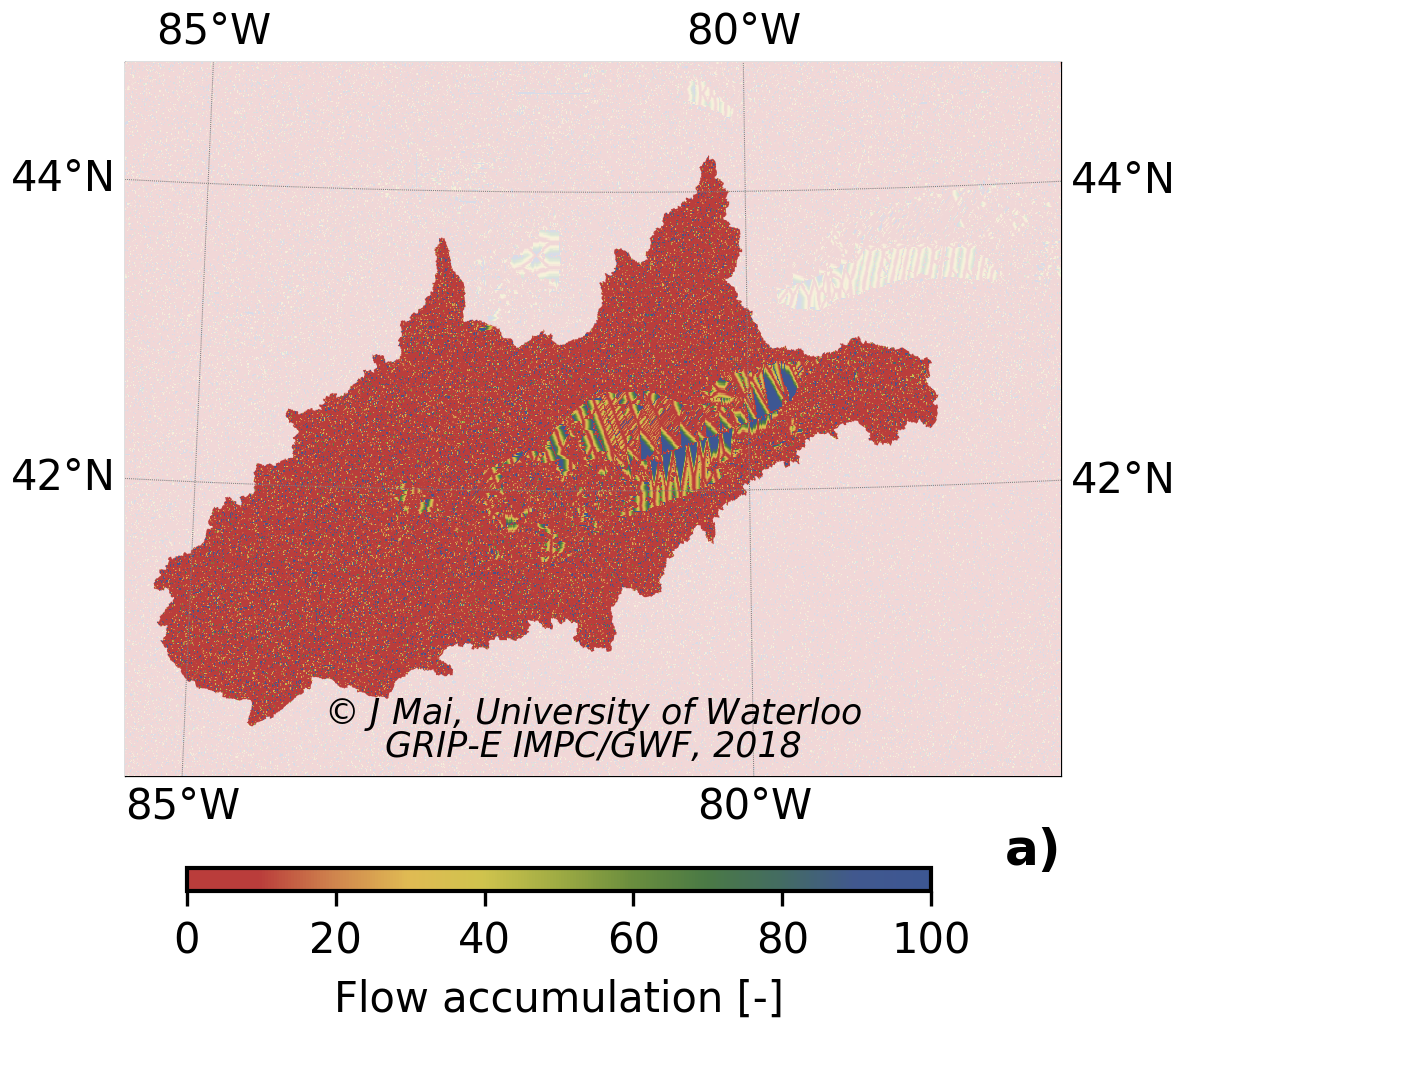
The above mentioned DEM was used to derive the flow direction and accumulation with ArcGIS.
This dataset is used for all models for Phase 2 and onwards.
The 3'' data for the Lake Erie basin are available on GitHub in Esri raster format and NetCDF on a regular lat-lon grid for the domain of latitudes between (40.00041580200195, 44.99958419799805) [degrees north] and longitudes between (-85.99958038330078,-77.00041961669922) [degrees east].
This dataset is used for VIC, VIC-GRU, HYPE, GR4J-lp, and GR4J-sd in Phase 0 and 1.
The 15'' data for the Lake Erie Basin are available on GitHub in Esri raster format and NetCDF on a regular lat-lon grid for the domain of latitudes between (40.381248474121094, 44.23125076293945) [degrees north] and longitudes between (-85.32765197753906,-78.27348327636719) [degrees east].
This dataset is used for all models for Phase 2 and onwards.
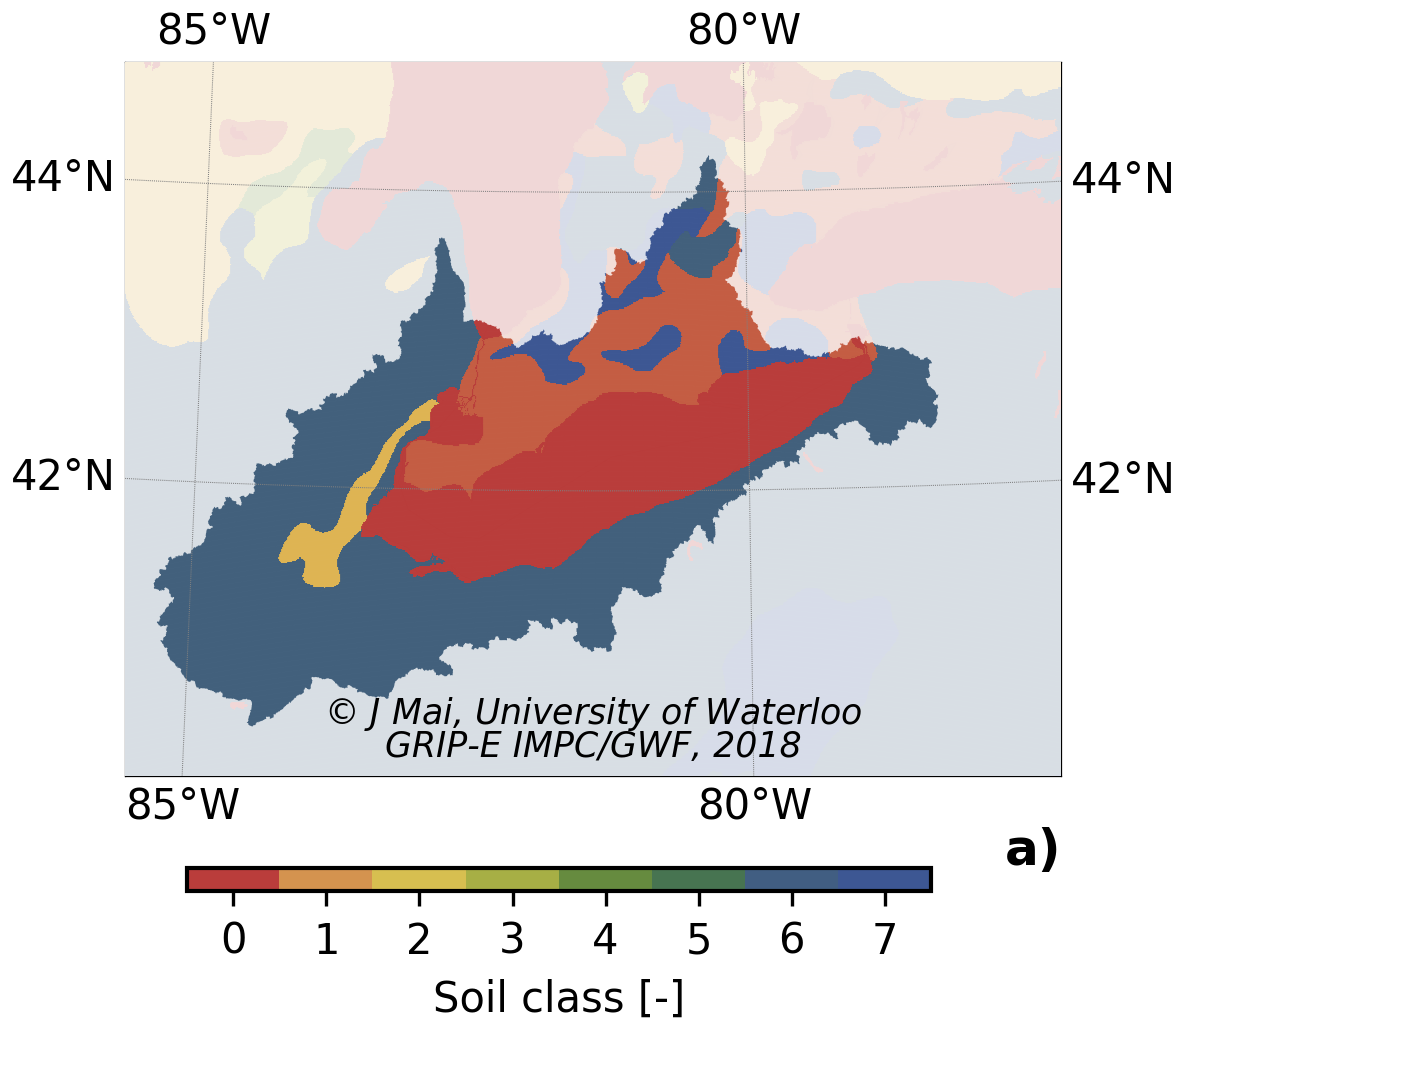
As a common soil dataset for all models we used the Global Soil Dataset for Earth System Models (GSDE) (30'' ~ 1km) containing 8 layers of soil to a depth of 2.3m. The data can be downloaded here. A publication of this product is available here. It contains also a comparison of the HWSD and GSDE (see Figures 4 to 6).
This dataset is used for VIC, VIC-GRU, and HYPE in Phase 0 and 1.
These models took the FAO Harmonized World Soil Database (HWSD) v1.2 as our soil database. This data are at a 30'' resolution which corresponds to about 1km at the equator. Data are available for the Lake Erie Basin on GitHub in Esri raster format and NetCDF on a regular lat-lon grid for the domain of latitudes between (40.00416564941406,44.99583435058594) [degrees north] and longitudes between (-85.99583435058594,-77.00416564941406) [degrees east].
This dataset is used for all models for Phase 2 and onwards. However, currently only HYPE is using this data.
As the common dataset for groundwater table depths we used the Global patterns of groundwater table depth (30'' ≈ 1 km) available for download here. A documentation can be found in a publication by Fan et al. (2013) here. Provided information are average of observed values at well sites and simulated water table depth at 30'' and 0.25° resolution.
This dataset is used for all models for Phase 2 and onwards.
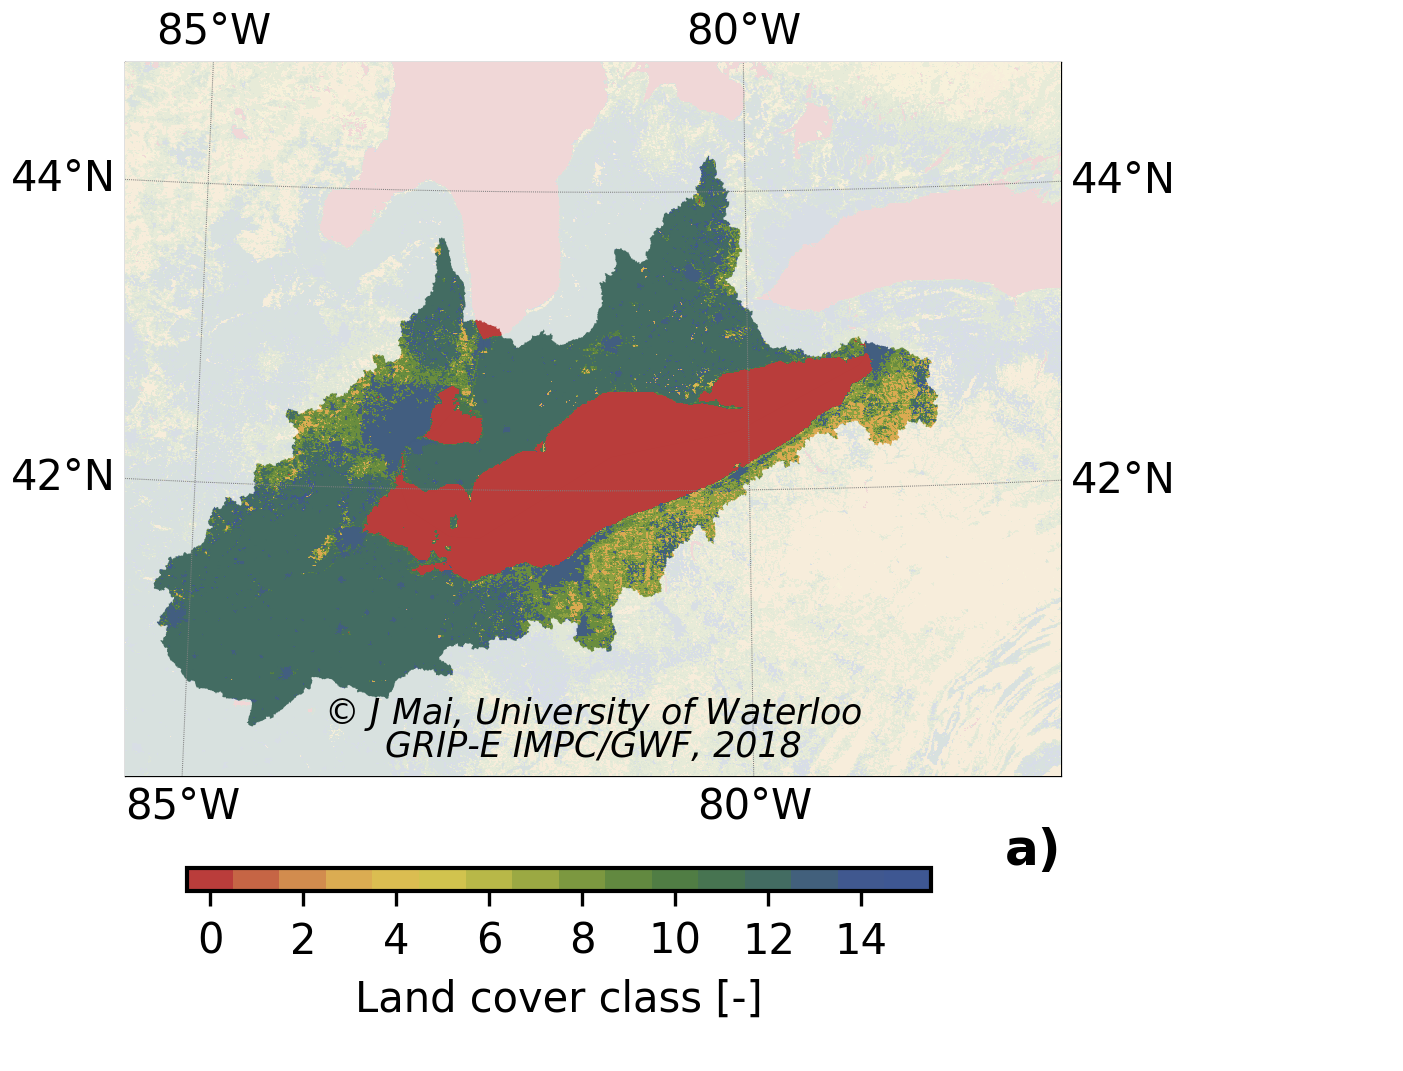
As a common landcover dataset for all models we used the NALCMS product including 19 land cover classes for North America (30m, Landsat, 2010 from Mexico and Canada, 2011 for U.S.). The data can be downloaded here and a documentation can be found here.
This dataset is used for VIC in Phase 0 and 1.
The land cover classes were derived from the MODIS/Terra+Aqua Land Cover Type Yearly L3 Global 500m SIN Grid V006 (MCD12Q1_006) provided by the USGS. This global product has a 500 m resolution. Only the data images of 2016 have been used for the initial land cover parametrization. Data are available for Lake Erie basin on GitHub in Esri raster format and NetCDF on a regular lat-lon grid for the domain of latitudes between (40.00264358520508,44.996395111083984) [degrees north] and longitudes between (-85.99735260009766,-77.0043716430664) [degrees east].
Hongren Shen (Waterloo) did a rough comparison among the MODIS land cover data set and other similar products, such as GlobCover 2009, NALCMS 2010, UMD land cover 1990s, and GLAHF 2011-2012. The main reason why he has decided to use MODIS are two as follows:
- Acceptable spatial resolutions and it is the latest product, which makes it potentially available if we want to extend our study to the nearest years.
- MODIS provides six land cover classification schemes, making it versatile in parameterization procedures.
One key point of this study is that all participating models had to use the same forcing dataset, here the Regional Deterministic Reanalysis System version 1 (RDRS-v1).
The RDRS dataset is a preliminary sample of an atmospheric reforecast and precipitation/ land-surface reanalysis dataset that has recently been developed and released by Environment and Climate Change Canada (Gasset et al. 2017, Gasset et al. 2021). The data had been provided to this project already before its public release. The dataset was chosen because of its high spatial and temporal resolution and the availability of all variables required to setup hydrologic and land-surface models. A full list of variables including units and vertical level can be found in the table below. The data are available on CaSPAr (Mai et al. 2020).
This dataset was obtained from short-term (6-h to 18-h lead time) meso-scale (15~km) integrations of the Global Environmental Multiscale (GEM) atmospheric model coupled to the Canadian Land Data Assimilation system (CaLDAS) and to the Canadian Precipitation Analysis (CaPA), launched every 12 hours from initial atmospheric conditions provided by the ERA-Interim reanalysis (Gasset et al. 2021). A technical report is available here.
The data have an hourly temporal resolution and a spatial resolution of about 15 km. It is available for the 5 years of 2010 to 2014. The dataset originally covers North and Central America. The domain of Lake Erie was cropped for this project. Data are available as NetCDF on a rotated lat-lon grid for the domain of latitudes between (38.91452407836914,45.38602828979492) [degrees north] and longitudes between (-85.86407470703125,-77.44696044921875) [degrees east]. The variables available in the dataset are:
| Variable | Var. name |
Long name | Unit | Level |
|---|---|---|---|---|
| Precipitation Rate | PR0 | Quantity of precipitation | [m] | SFC |
| Air Temperature | TT | Air temperature | [°C] | 40m |
| Inc. Shortwave Radiation | FB | Downward solar flux | [W/m2] | SFC |
| Inc. Longwave Radiation | FI | Surface inc. infrared flux | [W/m2] | SFC |
| Atmospheric Pressure | P0 | Surface pressure | [mb] | SFC |
| Specific Humidity | HU | Specific humidity | [kg/kg] | 40m |
| Wind Components | UU,VV | U/V-component of wind (along grid X/Y) |
[kts] | 40m |
| Corrected Wind Components | UUC,VVC | U/V-component of wind (along W-E/S-N direct.) |
[kts] | 40m |
| Wind Speed | UVC | Wind Modulus | [kts] | 40m |
| Wind Direction | WDC | Meteorol. wind direction | [degree] | 40m |

Objective #1 used only stations monitoring daily discharge of naturalized watersheds. This is in total 15 Canadian and 13 US American stations (gauge info (cal) and gauge info (val)).
The data are available in the raw data format (csv/txt (cal)/csv/txt (val)) and in NetCDF (cal)/NetCDF (val) format. The latter one includes a conversion of all data into [m3/s] and a merging of all data and their metadata into one single NetCDF file.
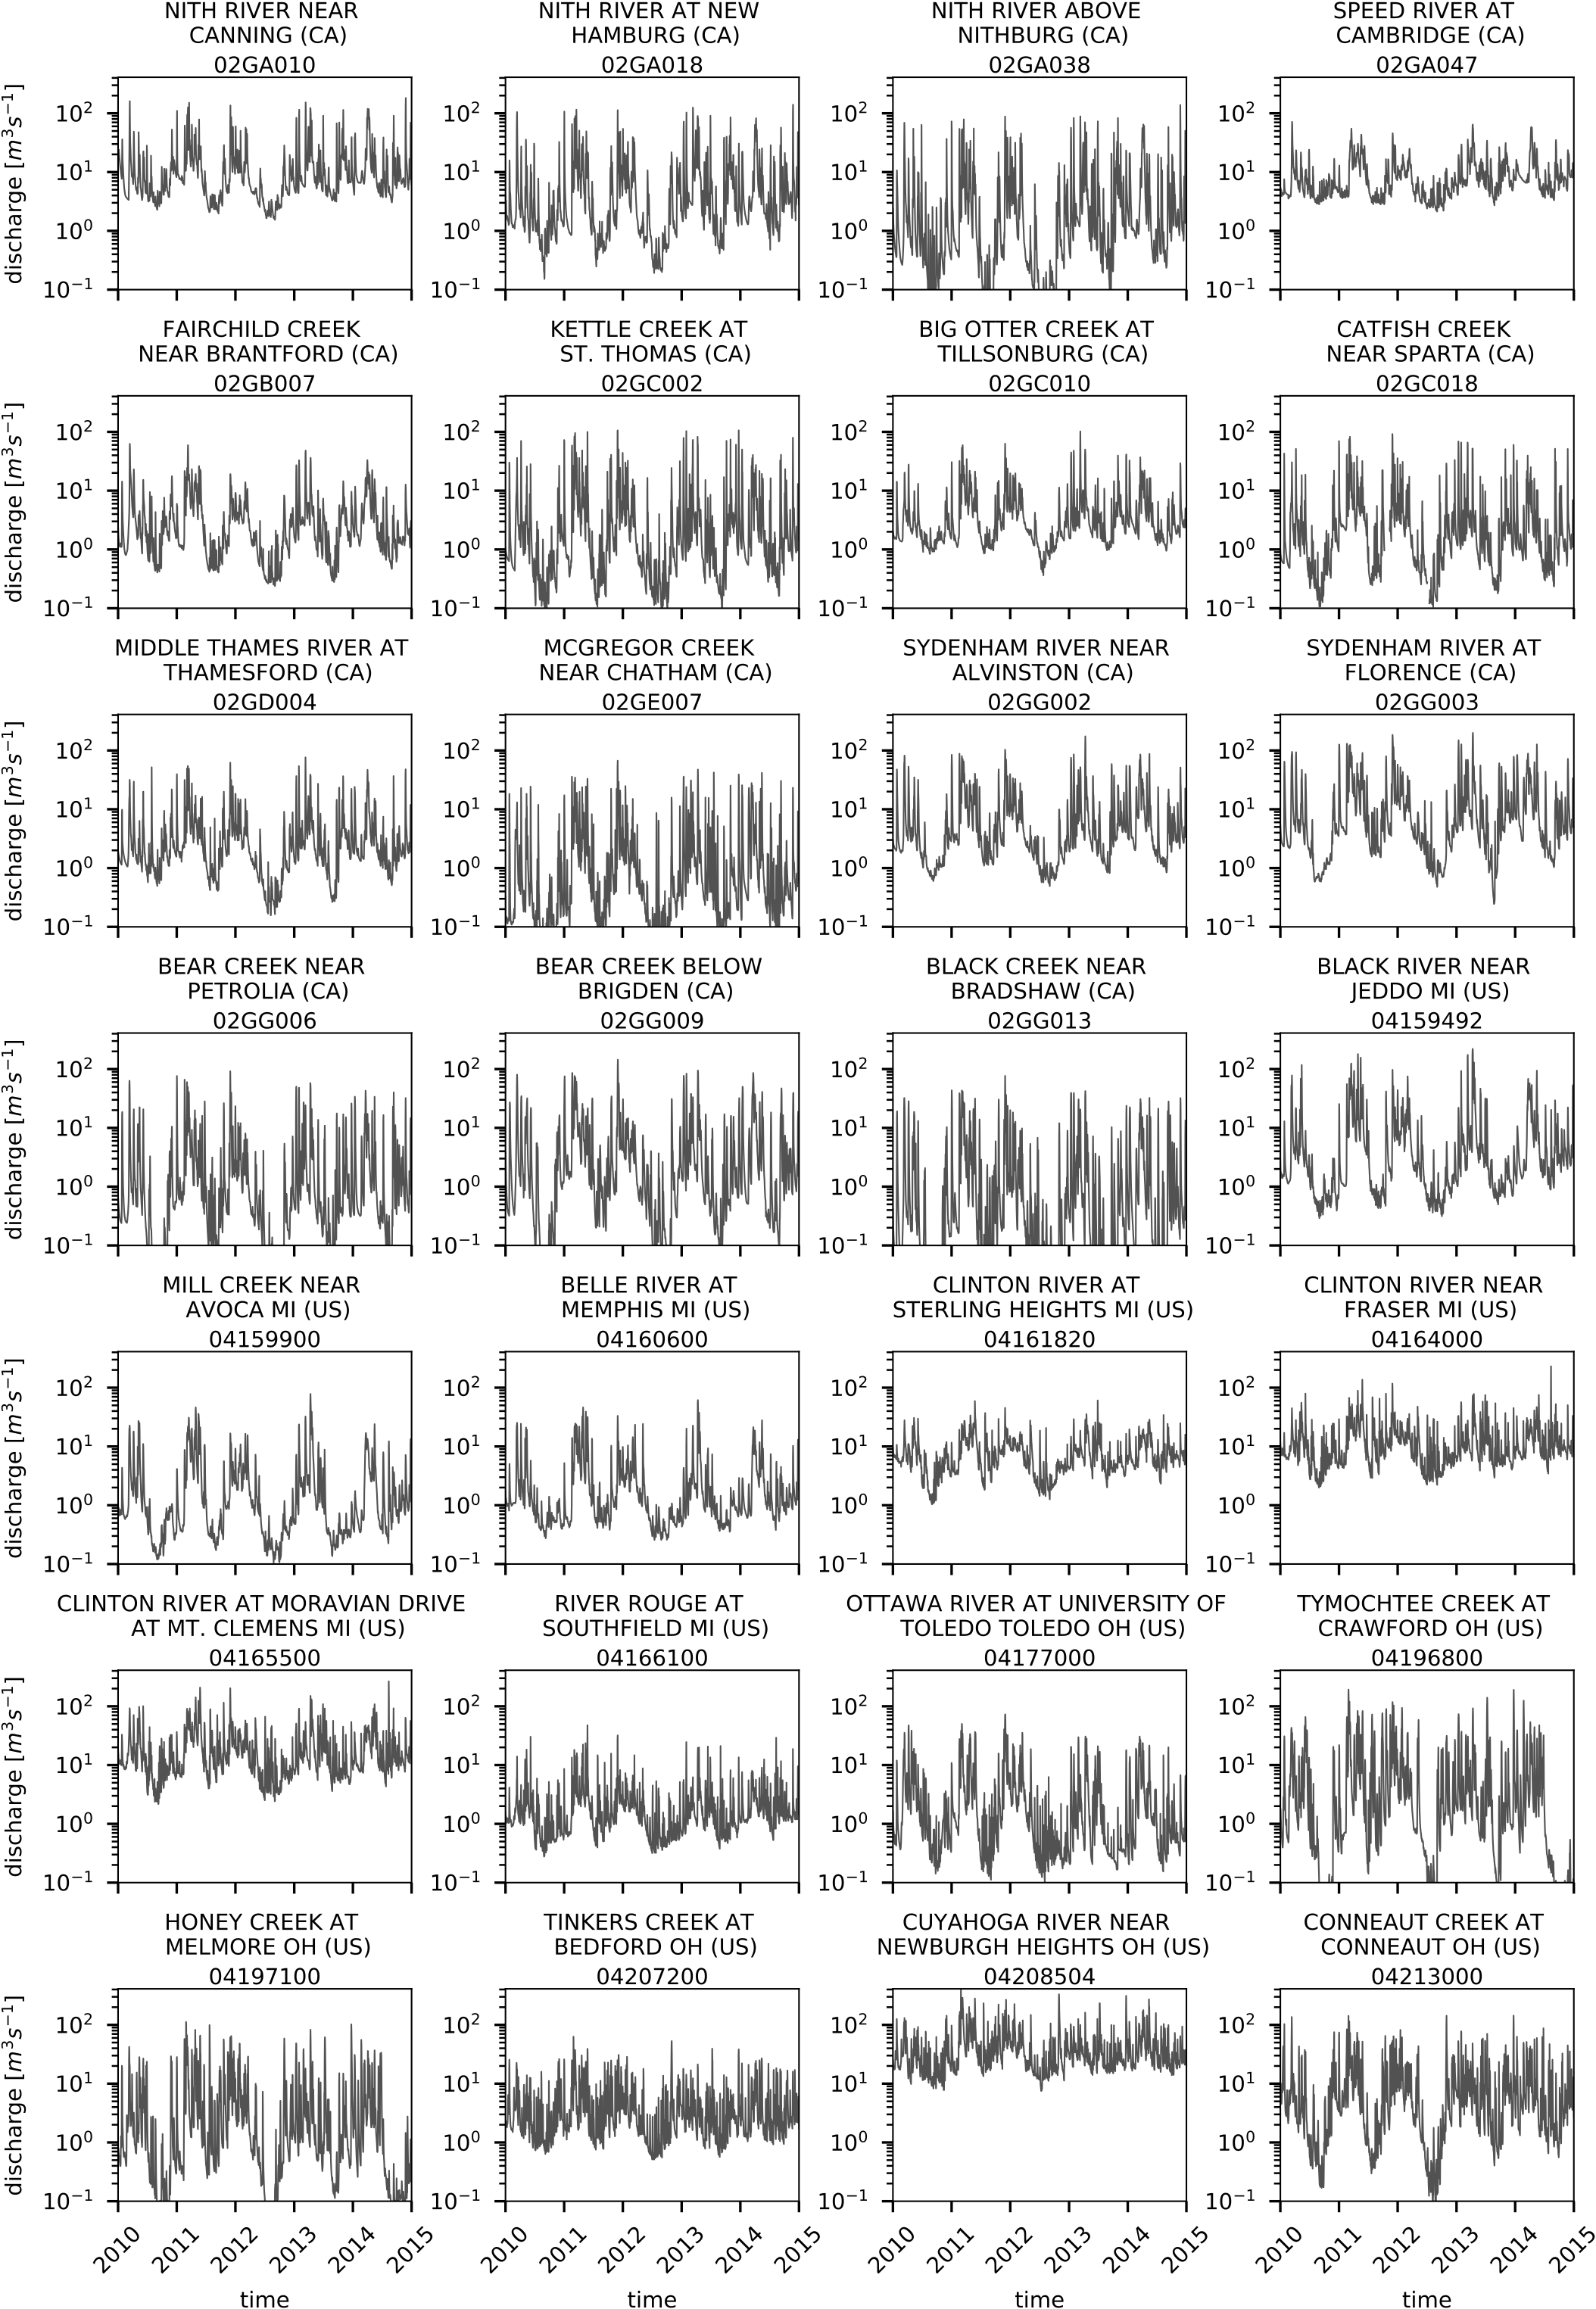
Objective #2 is focussing only on getting the inflows to Lake Erie correct. Therefore stations of either naturalized or managed watersheds are used. Only the most downstream gauging stations are considered here. This is 10 Canadian and 21 US American stations (gauge info (cal) and gauge info (val)).
The data are available in the raw data format (csv/txt (cal)/csv/txt (val)) and in NetCDF (cal)/NetCDF (val) format. The latter one includes a conversion of all data into [m3/s] and a merging of all data and their metadata into one single NetCDF file.

![]()
![]()
![]()
![]()
![]()
![]()
![]()
![]()
© 2018-2021 - GRIP-E project - juliane.mai@uwaterloo.ca
Funded under IMPC project of Global Water Futures program.
![]()
![]()
Table of contents