InferLoop: leveraging single-cell chromatin accessibility for the signal of chromatin loop, Briefings in Bioinformatics, 2023, https://doi.org/10.1093/bib/bbad166
This tool is designed for inferring loop signals of cell clusters (bins) or individual cells (high depth) using scATAC-seq data
| Section | Content | Platform |
|---|---|---|
| Section I | Using Signac to process the scATAC-seq data | R |
| Section II | Using Cicero to predict global loops | R |
| Section III | Preparing input files of InferLoop | R |
| Section IV ( Core ) | Using InferLoop to infer loop signals | R or Python3 |
| Section V | Generating cell-type specific loop signals | R |
| Section VI | Identifying cell-type specific loops | R |
R 4.2.0
library(data.table) # 1.14.2
library(stringr)    # 1.4.0
library(parallel)   # 4.2.0
library(hash)       # 2.2.6.2
library(Seurat)     # 4.1.1
library(Signac)     # 1.7.0
library(monocle)    # 2.24.1
#monocle2, https://www.bioconductor.org/packages/release/bioc/html/monocle.html
library(cicero)     # 0.8.10
#cicero for monocle2, https://cole-trapnell-lab.github.io/cicero-release/docs/
library(glassoFast) # 1.0
Python 3.7.9
import sys
import _pickle as pickle
import numpy              # 1.20.0
from scipy import stats   # 1.5.4
Key words: scATAC-seq, 10x genomics, PBMC
| File | Link |
|---|---|
| Counts | atac_v1_pbmc_10k_filtered_peak_bc_matrix.h5 |
| Metadata | atac_v1_pbmc_10k_singlecell.csv |
| Fragments | atac_v1_pbmc_10k_fragments.tsv.gz |
| Fragments index | atac_v1_pbmc_10k_fragments.tsv.gz.tbi |
| Annotation reference | pbmc_10k_v3.rds |
The official website of Signac
# /home/toolkit/tools/R4.2.0/bin/R
setwd('/home/disk/database/data/ICS_scHIC/fzz_website_demo')

library(Signac)
library(Seurat)
library(GenomeInfoDb)
library(EnsDb.Hsapiens.v75)
library(ggplot2)
library(patchwork)
set.seed(1234)

counts <- Read10X_h5(filename = "atac_v1_pbmc_10k_filtered_peak_bc_matrix.h5")

metadata <- read.csv(
    file = "atac_v1_pbmc_10k_singlecell.csv",
    header = TRUE,
    row.names = 1
    )

chrom_assay <- CreateChromatinAssay(
    counts = counts,
    sep = c(":", "-"),
    genome = 'hg19',
    fragments = 'atac_v1_pbmc_10k_fragments.tsv.gz',
    min.cells = 10,
    min.features = 200
    )

pbmc <- CreateSeuratObject(
    counts = chrom_assay,
    assay = "peaks",
    meta.data = metadata
    )

annotations <- GetGRangesFromEnsDb(ensdb = EnsDb.Hsapiens.v75)
annotations@seqnames@values=paste0('chr',annotations@seqnames@values)
annotations@seqinfo@seqnames=paste0('chr',annotations@seqinfo@seqnames)
annotations@seqinfo@genome=rep('hg19',length(annotations@seqinfo@genome))
annotations@seqnames@values[which(annotations@seqnames@values=='chrMT')]='chrM'
annotations@seqinfo@seqnames[which(annotations@seqinfo@seqnames=='chrMT')]='chrM'
annotations@seqnames@values=factor(annotations@seqnames@values,levels=annotations@seqinfo@seqnames)

Annotation(pbmc) <- annotations

pbmc <- NucleosomeSignal(object = pbmc)
pbmc <- TSSEnrichment(object = pbmc, fast = FALSE)
pbmc$pct_reads_in_peaks <- pbmc$peak_region_fragments / pbmc$passed_filters * 100
pbmc$blacklist_ratio <- pbmc$blacklist_region_fragments / pbmc$peak_region_fragments

pbmc <- subset(
    x = pbmc,
    subset = peak_region_fragments > 3000 &
    peak_region_fragments < 20000 &
    pct_reads_in_peaks > 15 &
    blacklist_ratio < 0.05 &
    nucleosome_signal < 4 &
    TSS.enrichment > 2
    )

# Call peaks using MACS2

peaks <- CallPeaks(pbmc, macs2.path = "/home/toolkit/local/bin/macs2")
peaks <- keepStandardChromosomes(peaks, pruning.mode = "coarse")
peaks <- subsetByOverlaps(x = peaks, ranges = blacklist_hg19, invert = TRUE)

saveRDS(peaks, 'peaks_macs2.rds')

macs2_counts <- FeatureMatrix(
    fragments = Fragments(pbmc),
    features = peaks,
    cells = colnames(pbmc)
    )

pbmc[["macs2"]] <- CreateChromatinAssay(
    counts = macs2_counts,
    fragments = 'atac_v1_pbmc_10k_fragments.tsv.gz',
    annotation = annotations
    )

DefaultAssay(pbmc)='macs2'
pbmc <- RunTFIDF(pbmc)
pbmc <- FindTopFeatures(pbmc, min.cutoff = 'q0')
pbmc <- RunSVD(pbmc)

pbmc <- RunUMAP(object = pbmc, reduction = 'lsi', dims = 2:30)
pbmc <- FindNeighbors(object = pbmc, reduction = 'lsi', dims = 2:30)
pbmc <- FindClusters(object = pbmc, verbose = FALSE, algorithm = 3)

DimPlot(object = pbmc, label = TRUE) + NoLegend()

gene.activities <- GeneActivity(pbmc)

pbmc[['RNA']] <- CreateAssayObject(counts = gene.activities)
DefaultAssay(pbmc)='RNA'
pbmc <- RunTFIDF(pbmc)

pbmc_rna <- readRDS("pbmc_10k_v3.rds")

transfer.anchors <- FindTransferAnchors(
    reference = pbmc_rna,
    query = pbmc,
    reduction = 'cca'
    )

 predicted.labels <- TransferData(
     anchorset = transfer.anchors,
     refdata = pbmc_rna$celltype,
     weight.reduction = pbmc[['lsi']],
     dims = 2:30
     )

pbmc <- AddMetaData(object = pbmc, metadata = predicted.labels)

plot1 <- DimPlot(
    object = pbmc_rna,
    group.by = 'celltype',
    label = TRUE,
    repel = TRUE) + NoLegend() + ggtitle('scRNA-seq')

plot2 <- DimPlot(
    object = pbmc,
    group.by = 'predicted.id',
    label = TRUE,
    repel = TRUE) + NoLegend() + ggtitle('scATAC-seq')

plot1 + plot2

saveRDS(pbmc, file='pbmc_signac.rds')
The official website of Cicero
library(monocle)
library(cicero)
source('https://raw.githubusercontent.com/jumphone/InferLoop/main/inferloop/InferLoop.R')

pbmc=readRDS(file='pbmc_signac.rds')
DefaultAssay(pbmc)='macs2'

indata=as.matrix(pbmc[['macs2']]@data)
used_coords=pbmc@reductions$umap@cell.embeddings
genome.df=inferloop.getGenomeDF.hg19()

conns=inferloop.cicero(indata, used_coords, genome.df)

saveRDS(conns, file='conns_cicero.rds')
source('https://raw.githubusercontent.com/jumphone/InferLoop/main/inferloop/InferLoop.R')

pbmc=readRDS(file='pbmc_signac.rds')
DefaultAssay(pbmc)='macs2'
conns=readRDS(file='conns_cicero.rds')

# The output loops of Cicero are not unique, and use top 400,000 loops will get top 200,000 unique loops
inferloop.writeNet(conns, "net.txt", cut=400000)

indata=as.matrix(pbmc[['macs2']]@data)
used_coords=pbmc@reductions$umap@cell.embeddings

BIN=inferloop.generateBin(indata,used_coords, n=100)
saveRDS(BIN, file='BIN.rds')

CLST=BIN$clst
write.table(BIN$mat,file='mat.txt', row.names=T,col.names=T,quote=F,sep='\t')
Download 'mat.txt' and 'net.txt' of demo data
source('https://raw.githubusercontent.com/jumphone/InferLoop/main/inferloop/InferLoop.R')
mat=inferloop.loadSignal('mat.txt')
net=read.table('net.txt',sep='\t',header=F,row.names=NULL)
net_uniq=inferloop.getUniqLoop(net)
MAT=inferloop.inferLoopSignal(mat, net_uniq, r=0)
write.table(MAT,file='signal_mat.txt', row.names=T,col.names=T,quote=F,sep='\t')
mkdir output
python3 inferloop/step0_uniqNet.py net.txt output/net_uniq.txt
python3 inferloop/step1_buildIndex.py output/net_uniq.txt mat.txt output/mat.index
python3 inferloop/step2_runInferLoop.py output/mat.index output/signal_mat.txt
# In order to adjust the parameter "r", users can modify "R" in "inferloop/step2_runInferLoop.py"
source('https://raw.githubusercontent.com/jumphone/InferLoop/main/inferloop/InferLoop.R')
pbmc=readRDS(file='pbmc_signac.rds')
DefaultAssay(pbmc)='macs2'
MAT=inferloop.loadSignal('output/signal_mat.txt')
CLST=readRDS('BIN.rds')$clst
MAT_CELL=inferloop.bin2cell(MAT, CLST)
TYPE=pbmc$predicted.id
MAT_TYPE=.generate_mean(MAT_CELL, TYPE)
saveRDS(MAT_TYPE, 'signal_mat_type.rds')
##################################
library(trackViewer)
library(InteractionSet)
library(TxDb.Hsapiens.UCSC.hg19.knownGene)
library(org.Hs.eg.db)
#####################
# CD4 gene, chr12:6898638-6929976
range <- GRanges("chr12", IRanges(6898638-20000, 6929976+20000))
ids <- getGeneIDsFromTxDb(range, TxDb.Hsapiens.UCSC.hg19.knownGene)
symbols <- mget(ids, org.Hs.egSYMBOL)
genes <- geneTrack(ids, TxDb.Hsapiens.UCSC.hg19.knownGene,
symbols, asList=FALSE)
#####################
loop=inferloop.splitLoop(rownames(MAT))
anchor1=inferloop.bed2granges(inferloop.splitLoop(loop[,1], '-',3))
anchor2=inferloop.bed2granges(inferloop.splitLoop(loop[,2], '-',3))
gi=GInteractions(anchor1,anchor2)
TMP=MAT_TYPE
TMP[which(TMP<0)]=0
score_type=as.data.frame(TMP)
score_type[which(score_type<0)]=0
score_CD4_Naive=score_type$'CD4 Naive'
score_CD8_Naive=score_type$'CD8 Naive'
gi_cd4=gi
gi_cd8=gi
mcols(gi_cd4)$score=score_CD4_Naive*100
mcols(gi_cd8)$score=score_CD8_Naive*100
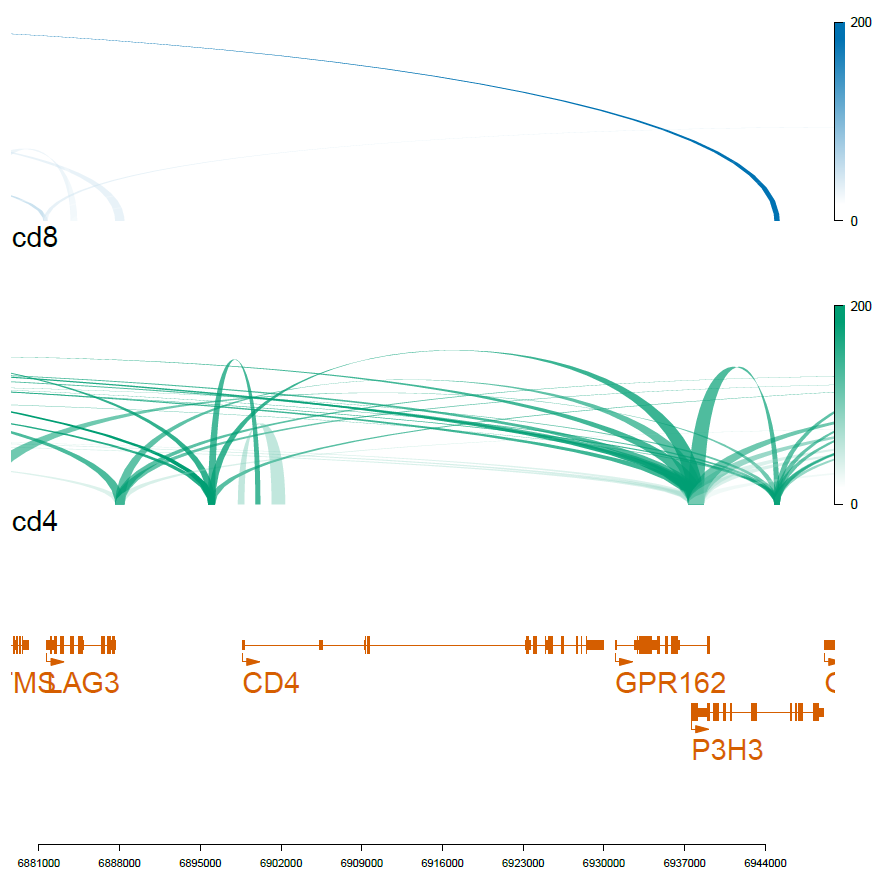
############################
cd4 <- gi2track(gi_cd4)
cd8 <- gi2track(gi_cd8)
############################
setTrackStyleParam(cd4, "tracktype", "link")
setTrackStyleParam(cd4, "breaks", c(seq(from=0, to=50, by=10), 200))
setTrackStyleParam(cd8, "tracktype", "link")
setTrackStyleParam(cd8, "breaks", c(seq(from=0, to=50, by=10), 200))
optSty <- optimizeStyle(trackList(genes, cd4, cd8), theme="safe")
trackListW <- optSty$tracks
viewerStyleW <- optSty$style
viewTracks(trackListW, gr=range, viewerStyle=viewerStyleW)
pdf('f01_celltype_ILS.pdf',width=7,height=7)
viewTracks(trackListW, gr=range, viewerStyle=viewerStyleW)
dev.off()
##################################
pbmc[['ILS']]=CreateAssayObject(data = MAT_CELL)
DefaultAssay(pbmc)='ILS'
Idents(pbmc)=pbmc$predicted.id
cd4_markers=FindMarkers(pbmc, ident.1='CD4 Naive', ident.2='CD8 Naive',test.use='t', only.pos=T, min.pct = 0.1, logfc.threshold = 0.1,verbose=T)
cd8_markers=FindMarkers(pbmc, ident.1='CD8 Naive', ident.2='CD4 Naive',test.use='t', only.pos=T, min.pct = 0.1, logfc.threshold = 0.1,verbose=T)
saveRDS(cd4_markers, file='cd4_markers.rds')
saveRDS(cd8_markers, file='cd8_markers.rds')
N=20000
cd4_loops=rownames(cd4_markers[1:N,])
cd8_loops=rownames(cd8_markers[1:N,])
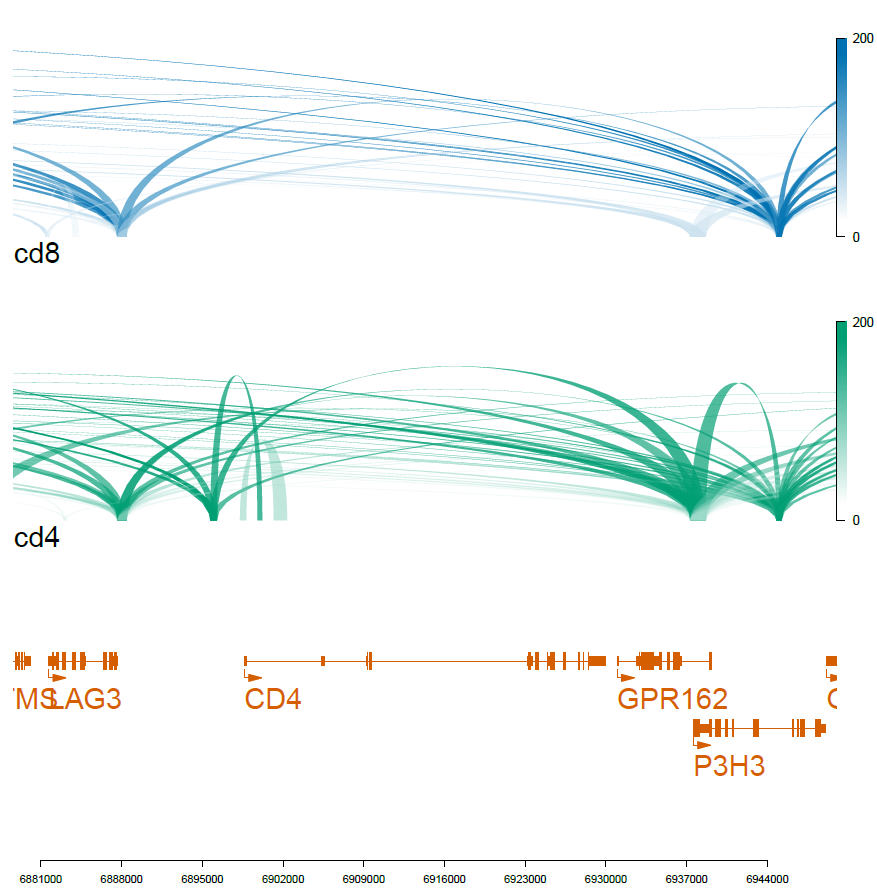
##################################
library(trackViewer)
library(InteractionSet)
library(TxDb.Hsapiens.UCSC.hg19.knownGene)
library(org.Hs.eg.db)
#####################
# CD4 gene, chr12:6898638-6929976
range <- GRanges("chr12", IRanges(6898638-20000, 6929976+20000))
ids <- getGeneIDsFromTxDb(range, TxDb.Hsapiens.UCSC.hg19.knownGene)
symbols <- mget(ids, org.Hs.egSYMBOL)
genes <- geneTrack(ids, TxDb.Hsapiens.UCSC.hg19.knownGene,
symbols, asList=FALSE)
#####################
loop=inferloop.splitLoop(rownames(MAT))
anchor1=inferloop.bed2granges(inferloop.splitLoop(loop[,1], '-',3))
anchor2=inferloop.bed2granges(inferloop.splitLoop(loop[,2], '-',3))
gi=GInteractions(anchor1,anchor2)
TMP=MAT_TYPE
TMP[which(TMP<0)]=0
score_type=as.data.frame(TMP)
score_type[which(score_type<0)]=0
score_CD4_Naive=score_type$'CD4 Naive'
score_CD4_Naive[which(! rownames(MAT) %in% cd4_loops)]=0
score_CD8_Naive=score_type$'CD8 Naive'
score_CD8_Naive[which(! rownames(MAT) %in% cd8_loops)]=0
gi_cd4=gi
gi_cd8=gi
mcols(gi_cd4)$score=score_CD4_Naive*100
mcols(gi_cd8)$score=score_CD8_Naive*100
############################
cd4 <- gi2track(gi_cd4)
cd8 <- gi2track(gi_cd8)
############################
setTrackStyleParam(cd4, "tracktype", "link")
setTrackStyleParam(cd4, "breaks", c(seq(from=0, to=50, by=10), 200))
setTrackStyleParam(cd8, "tracktype", "link")
setTrackStyleParam(cd8, "breaks", c(seq(from=0, to=50, by=10), 200))
optSty <- optimizeStyle(trackList(genes, cd4, cd8), theme="safe")
trackListW <- optSty$tracks
viewerStyleW <- optSty$style
viewTracks(trackListW, gr=range, viewerStyle=viewerStyleW)
pdf('f02_celltype_loops.pdf',width=7,height=7)
viewTracks(trackListW, gr=range, viewerStyle=viewerStyleW)
dev.off()
##################################