scRNAtoolVis Version 0.0.3 documentation
This version has been added more pameters to contol plot details with some advices and questions from users and my fans. If you want to use newly version, re-install it:
install.packages('devtools')
devtools::install_github('junjunlab/scRNAtoolVis')

library(scRNAtoolVis)
New features for clusterCornerAxes:
- change legend key size
- add cellType label in plot
- remove legend
New features for FeatureCornerAxes:
- remove legend
- no facet by samples
- specify the corner position
- set colorbar ranges
New features for AverageHeatmap:
- remove rownames
- remove cluster annotation name
- mark some genes important
Let's load test data:
library(Seurat)

test <- system.file("extdata", "seuratTest.RDS", package = "scRNAtoolVis")
tmp <- readRDS(test)

# add celltype
tmp$cellType <- Idents(tmp)You can set the keySize to change legend size:
# legend key size
clusterCornerAxes(object = tmp,
                  reduction = 'umap',
                  clusterCol = 'cellType',
                  noSplit = T,
                  keySize = 8)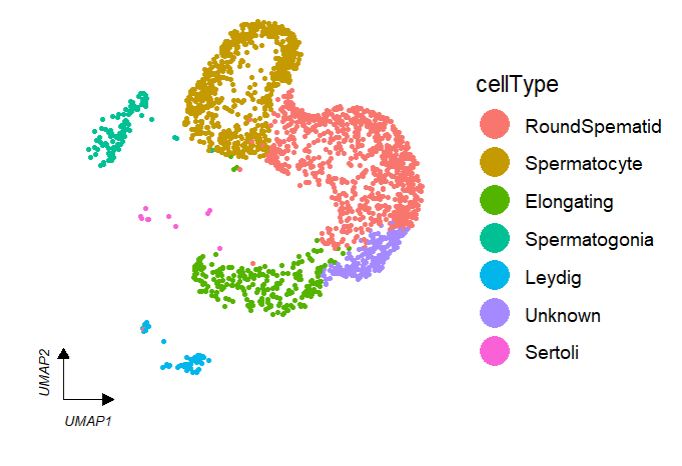
Add cellType names in plot:
# add cell type
clusterCornerAxes(object = tmp,
                  reduction = 'umap',
                  clusterCol = "cellType",
                  noSplit = T,
                  cellLabel = T,
                  cellLabelSize = 5)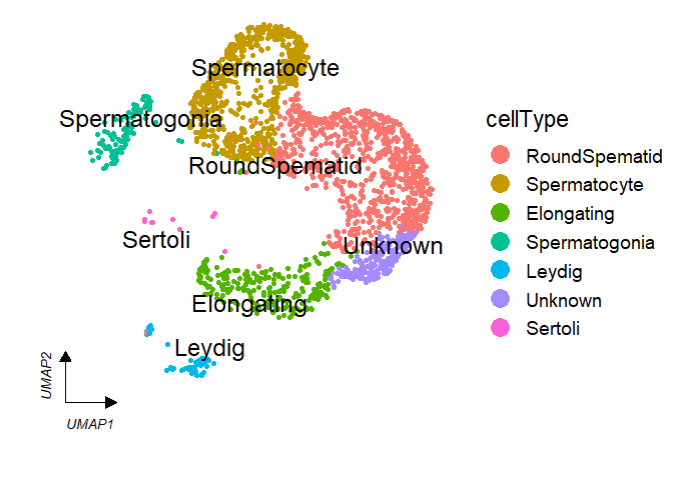
Remove legend:
# remove legend
clusterCornerAxes(object = tmp,
                  reduction = 'umap',
                  clusterCol = "cellType",
                  noSplit = T,
                  cellLabel = T,
                  cellLabelSize = 5,
                  show.legend = F)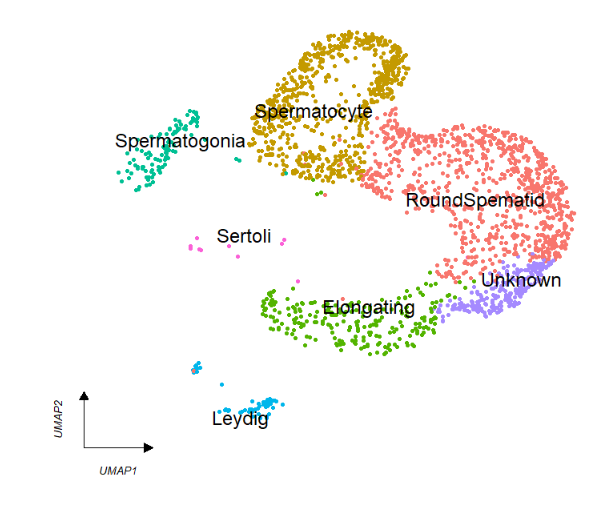
Split by group:
# split
clusterCornerAxes(object = tmp,
                  reduction = 'umap',
                  clusterCol = "cellType",
                  groupFacet = 'orig.ident',
                  noSplit = F,
                  cellLabel = T,
                  cellLabelSize = 3,
                  show.legend = F,
                  aspect.ratio = 1,
                  themebg = 'bwCorner')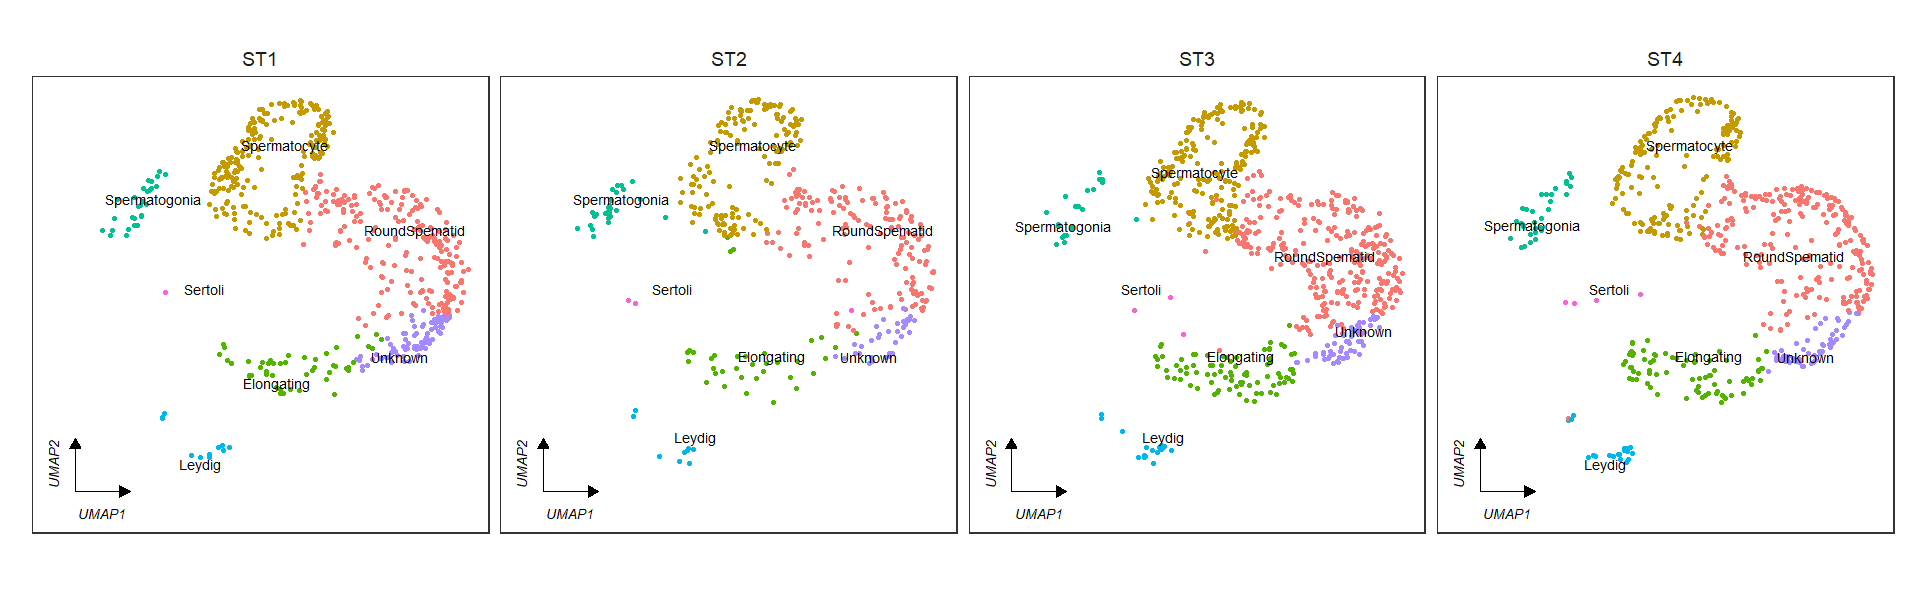
See the default plot:
# default
FeatureCornerAxes(object = tmp,reduction = 'umap',
                  groupFacet = 'orig.ident',
                  relLength = 0.5,
                  relDist = 0.2,
                  features = c("Actb","Ythdc1", "Ythdf2"))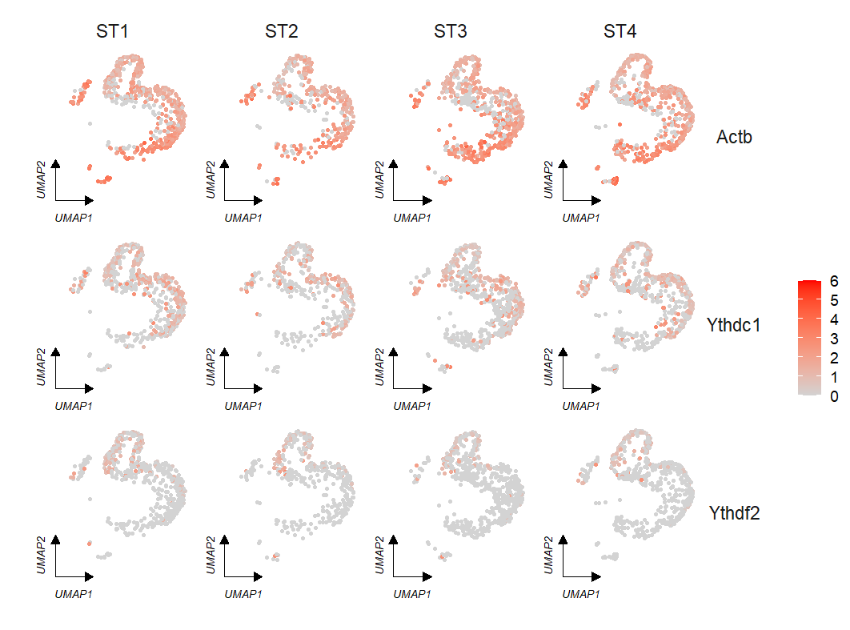
Remove legend:
# remove legend
FeatureCornerAxes(object = tmp,reduction = 'umap',
                  groupFacet = 'orig.ident',
                  relLength = 0.5,
                  relDist = 0.2,
                  features = c("Actb","Ythdc1", "Ythdf2"),
                  show.legend = F)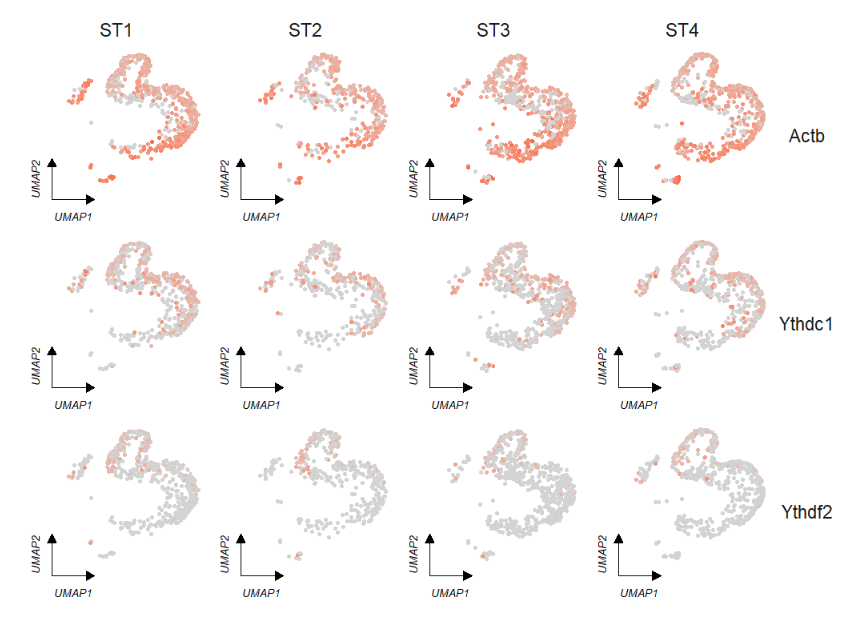
If we do not split the plot by group, we can set groupFacet = NULL:
# no facet group
FeatureCornerAxes(object = tmp,reduction = 'umap',
                  groupFacet = NULL,
                  relLength = 0.5,
                  relDist = 0.2,
                  features = c("Actb","Ythdc1", "Ythdf2"),
                  aspect.ratio = 1)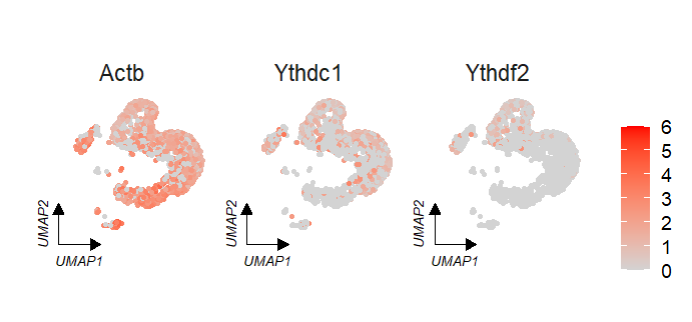
We can specify a group to change the corner axis position:
# specify corner position
p1 <- FeatureCornerAxes(object = tmp,reduction = 'umap',
                        groupFacet = 'orig.ident',
                        relLength = 0.5,
                        relDist = 0.2,
                        aspect.ratio = 1,
                        features = c("Actb","Ythdc1", "Ythdf2"),
                        axes = 'one')

p2 <- FeatureCornerAxes(object = tmp,reduction = 'umap',
                        groupFacet = 'orig.ident',
                        relLength = 0.5,
                        relDist = 0.2,
                        aspect.ratio = 1,
                        features = c("Actb","Ythdc1", "Ythdf2"),
                        axes = 'one',
                        cornerVariable = 'ST4')

# combine
cowplot::plot_grid(p1,p2,ncol = 2,align = 'hv')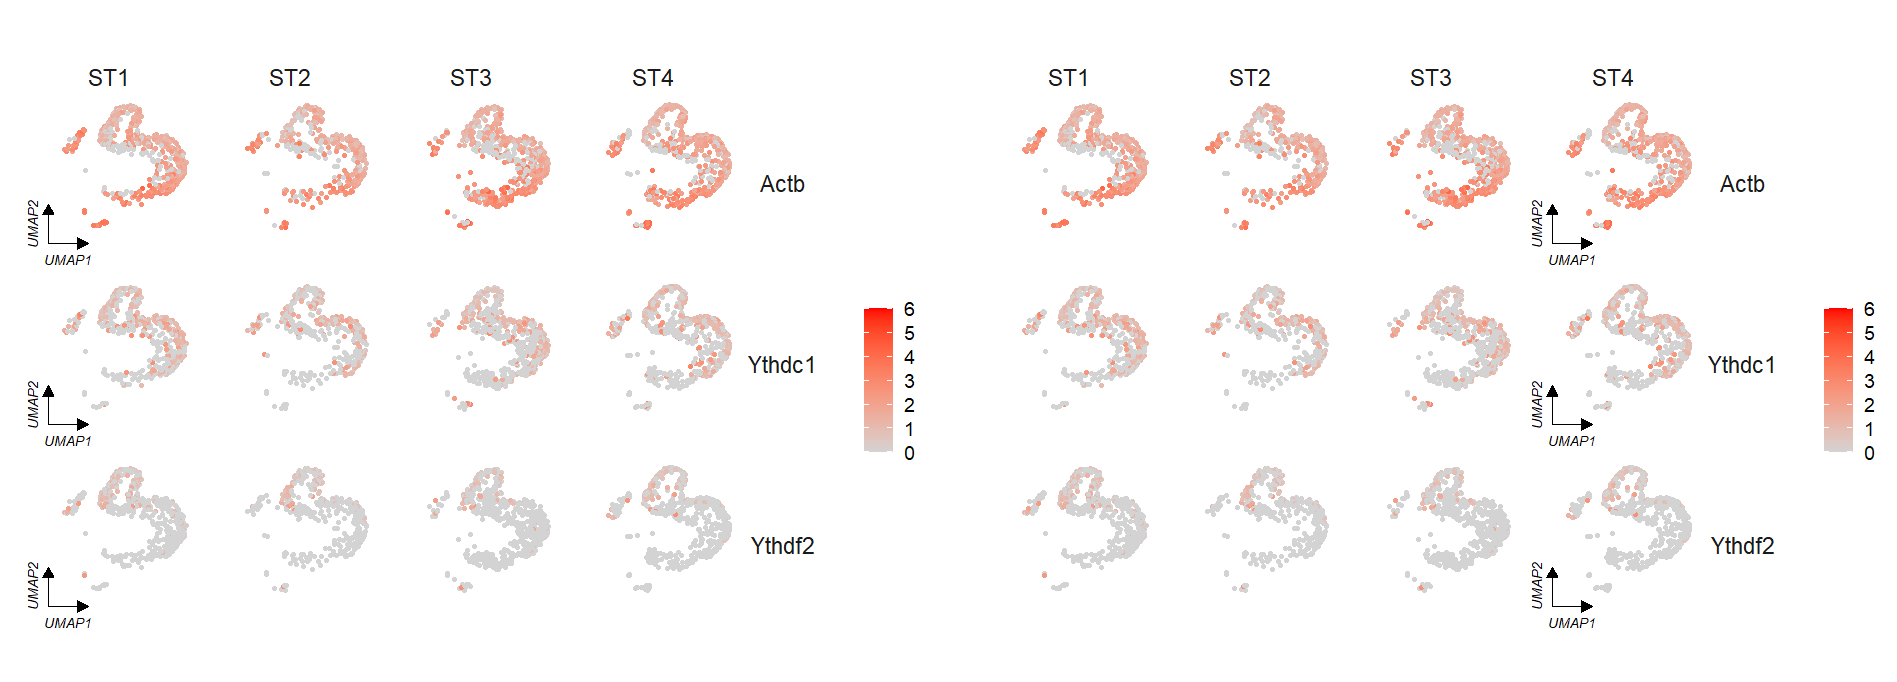
Besides, we can set the color bar value range:
# given a range to plot
p1 <- FeatureCornerAxes(object = tmp,reduction = 'umap',
                        groupFacet = NULL,
                        relLength = 0.5,
                        relDist = 0.2,
                        features = c("Actb","Ythdc1", "Ythdf2"),
                        aspect.ratio = 1,
                        themebg = 'bwCorner')

p2 <- FeatureCornerAxes(object = tmp,reduction = 'umap',
                        groupFacet = NULL,
                        relLength = 0.5,
                        relDist = 0.2,
                        features = c("Actb","Ythdc1", "Ythdf2"),
                        aspect.ratio = 1,
                        themebg = 'bwCorner',
                        minExp = 0,maxExp = 2)

# combine
cowplot::plot_grid(p1,p2,ncol = 1,align = 'hv')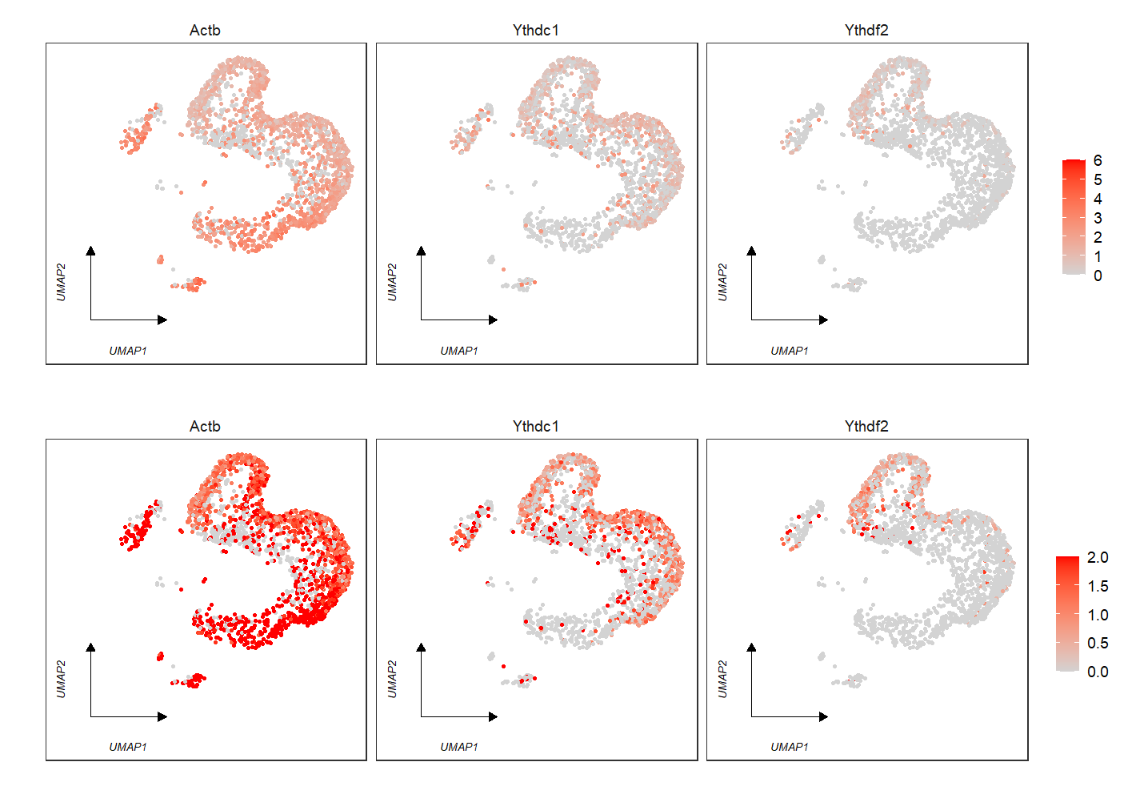
load test data:
httest <- system.file("extdata", "htdata.RDS", package = "scRNAtoolVis")
pbmc <- readRDS(httest)

# load markergene
markergene <- system.file("extdata", "top5pbmc.markers.csv", package = "scRNAtoolVis")
markers <- read.table(markergene, sep = ',', header = TRUE)
Remove rownames:
# remove rownames
AverageHeatmap(object = pbmc,
               markerGene = markers$gene,
               showRowNames = F)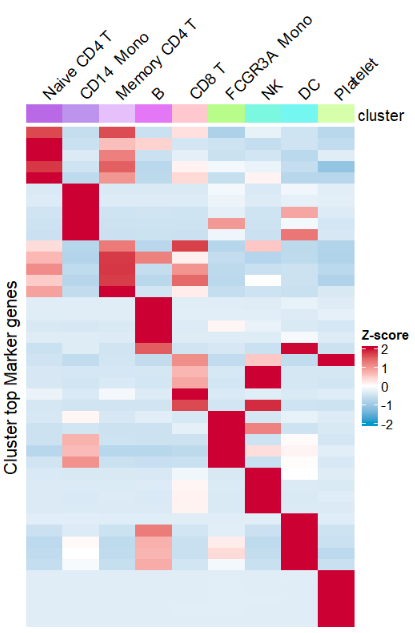
Remove annotation name:
# remove cluster anno name
AverageHeatmap(object = pbmc,
               markerGene = markers$gene,
               clusterAnnoName = F)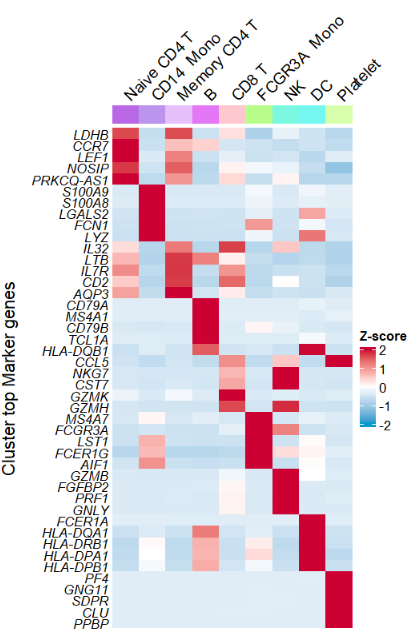
Mark some important genes:
# mark some genes
# tartget gene
annoGene <- c("LDHB","CCR7","LEF1","NKG7","CST7",
              "GZMK","HLA-DQA1","HLA-DRB1","HLA-DPA1")

AverageHeatmap(object = pbmc,
               markerGene = markers$gene,
               clusterAnnoName = F,
               showRowNames = F,
               markGenes = annoGene)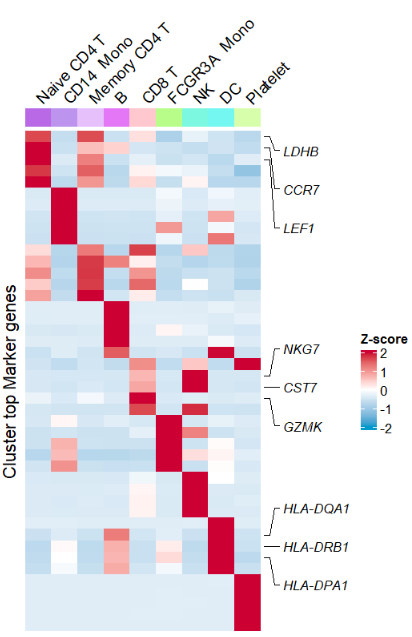
You can change heatmap width and height:
# change heatmap width and height
AverageHeatmap(object = pbmc,
               markerGene = markers$gene,
               clusterAnnoName = F,
               width = 8,height = 16)