Problems with "hours_to_show" = float value (particularly < 1.0) #181
Comments
|
I actually think this should already possible, If I remember correctly I removed the integer check a while back, but there were some issues with the tooltip timestamps back then when A config like this should give you a data point for each minute. hours_to_show: 0.083333
points_per_hour: 60Give it a shot and if it works we could probably update the docs. |
|
We could do something as follows:
The above should be fairly simple, right? I'd like to have such option for "point_per_hour", though it can be harder to implement. @kalkih I can work on it next weekend as long you like the idea |
|
Sure, that would be great and improve usability. Something like |
|
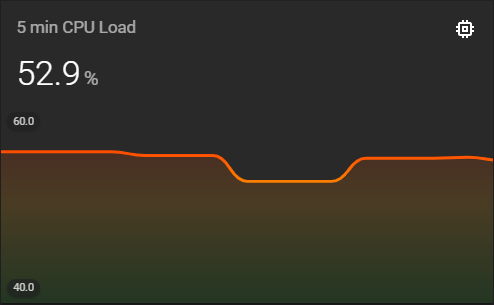
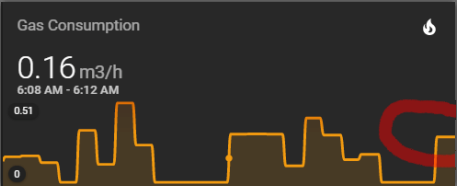
@kalkih hours_to_show: 0.083333 is working! But the graph is plotted from left to right somehow (current time is on the left):
Also the time is written backwards (and without seconds): Thanks so far, I can live with the small issues! |

|
@kalkih yes I was thinking about something like this as you suggested 10/h etc @QkulleQ I think graph is plotted correctly it is just the time which is shown not correct. Possible that I have introduced this bug recently as I remember I was adjusting this time by reducing the val by one min. Can take a look on the end of the week. |
|
@maxwroc there's definetely something wrong with the timestamps.
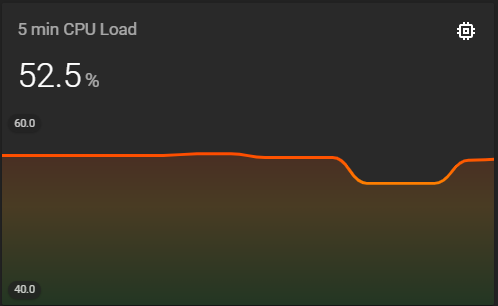
Are you sure? The first graph of that post is the oldest snapshot. Snapshots 2 and 3 were taken after the first one. The newer points on those snapshots are added on the left side. Shouldn't that be on the right side? I think this behavior is only happening with values below 1 for the hours_to_show option.
(BTW. notice the timestamp of the point has changed again) |

|
Yeah, there's definitely something funky going on when going below Another issue is that the graph only update/re-render when the entity state change, and in smaller timeframes like this it's def an issue, unless the sensor entity updates very frequently. The timestamps does however update on every card re-render. |
|
This issue has been automatically marked as stale because it has not had recent activity. It will be closed if no further activity occurs. Thank you for your contributions. If this is still an active issue, please let us know! |
|
The issue is stalled. |

|
Still an active issue, got it! Removing stale label. |
|
Reopen the issue! |

|
This issue has been automatically marked as stale because it has not had recent activity. It will be closed if no further activity occurs. Thank you for your contributions. If this is still an active issue, please let us know! |
|
I think, the changing timestamp could just be because the binning is not fixed (e.g. start of minute until end of minute). This is only the case, when using I suspect that the reversed order in which the times are shown is just a display/rounding issue. Maybe... But I haven't investigated. |
|
Interesting that now I managed to reproduce the glitch with
although earlier it was reported with values < 1... |

|
You're also asking a lot: 120 points per hour is less than a minute, which seems to be the resolution of the interval display. 😆 Still... Or should just show the same time twice. 🤔 |
|
Just to have the info here: this is where the magic happens: Line 528 in af01df1 And there's some condition on points per hour and hours to show. So, this might have it's flaws. But I cannot look into this deeply right now... |
The sensor is updated every 30 sec.
This, I think. |
* basically: use milliseconds in constants rather than fractions of hours
* also remove strange intervall size of n_points if hours < 1 and points/hour < 1
* also use 1 minute offset for end only when group_by, because that is cosmetics actually

fixes kalkih#181
|
🎉 This issue has been resolved in version 0.12.1 🎉 The release is available on GitHub release Your semantic-release bot 📦🚀 |
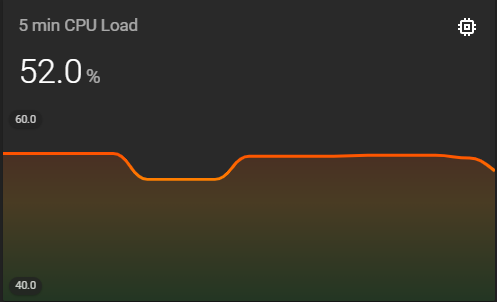
I would like to be able to show 5 min cpu load graphs.
But this means the hours_to_show option should be of type real number (0.083333) instead of integer.
Could this be made possible perhaps?
Love this very nice card btw :)
The text was updated successfully, but these errors were encountered: