Attaching to Web Inspector for Debugging
You can use Safari’s Web Inspector to debug Phoenix. Note, this only works on non-notarised versions of Phoenix (2.6.2 or older) or with debug builds. This can also be useful when you are developing your configuration since you can use the console as a shell (REPL). Follow the steps below to get started.
- Make sure Phoenix is running
- Open Safari
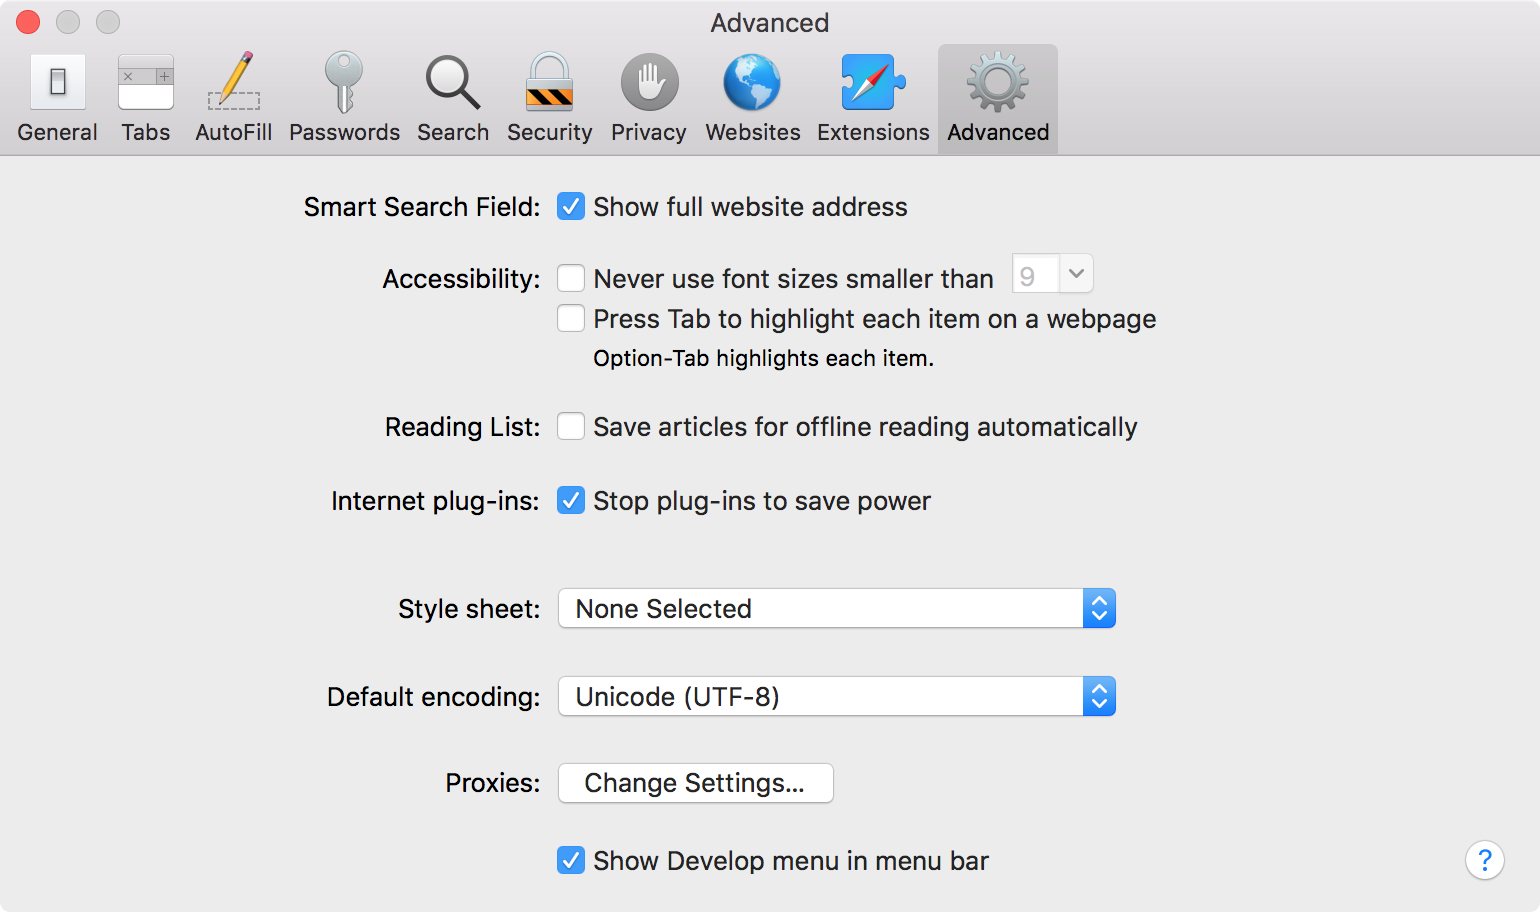
- Enable the “Develop” menu in Safari. To do this open Safari’s preferences and navigate to the “Advanced” tab. Make sure the option for “Show Develop menu in menu bar” is selected.
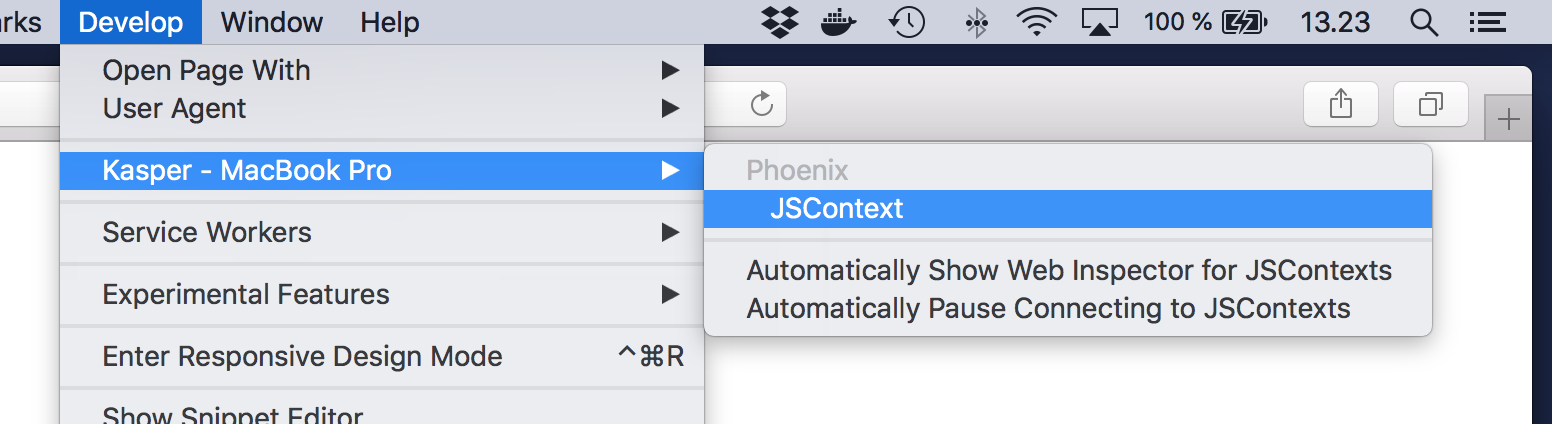
- Open the “Develop” menu from the menu bar, find the menu item with the name of your device and hover over it
- You should see an item for Phoenix in the submenu. Click on “JSContext” under Phoenix.
- A new Web Inspector window attached to Phoenix’s JavaScript context should open
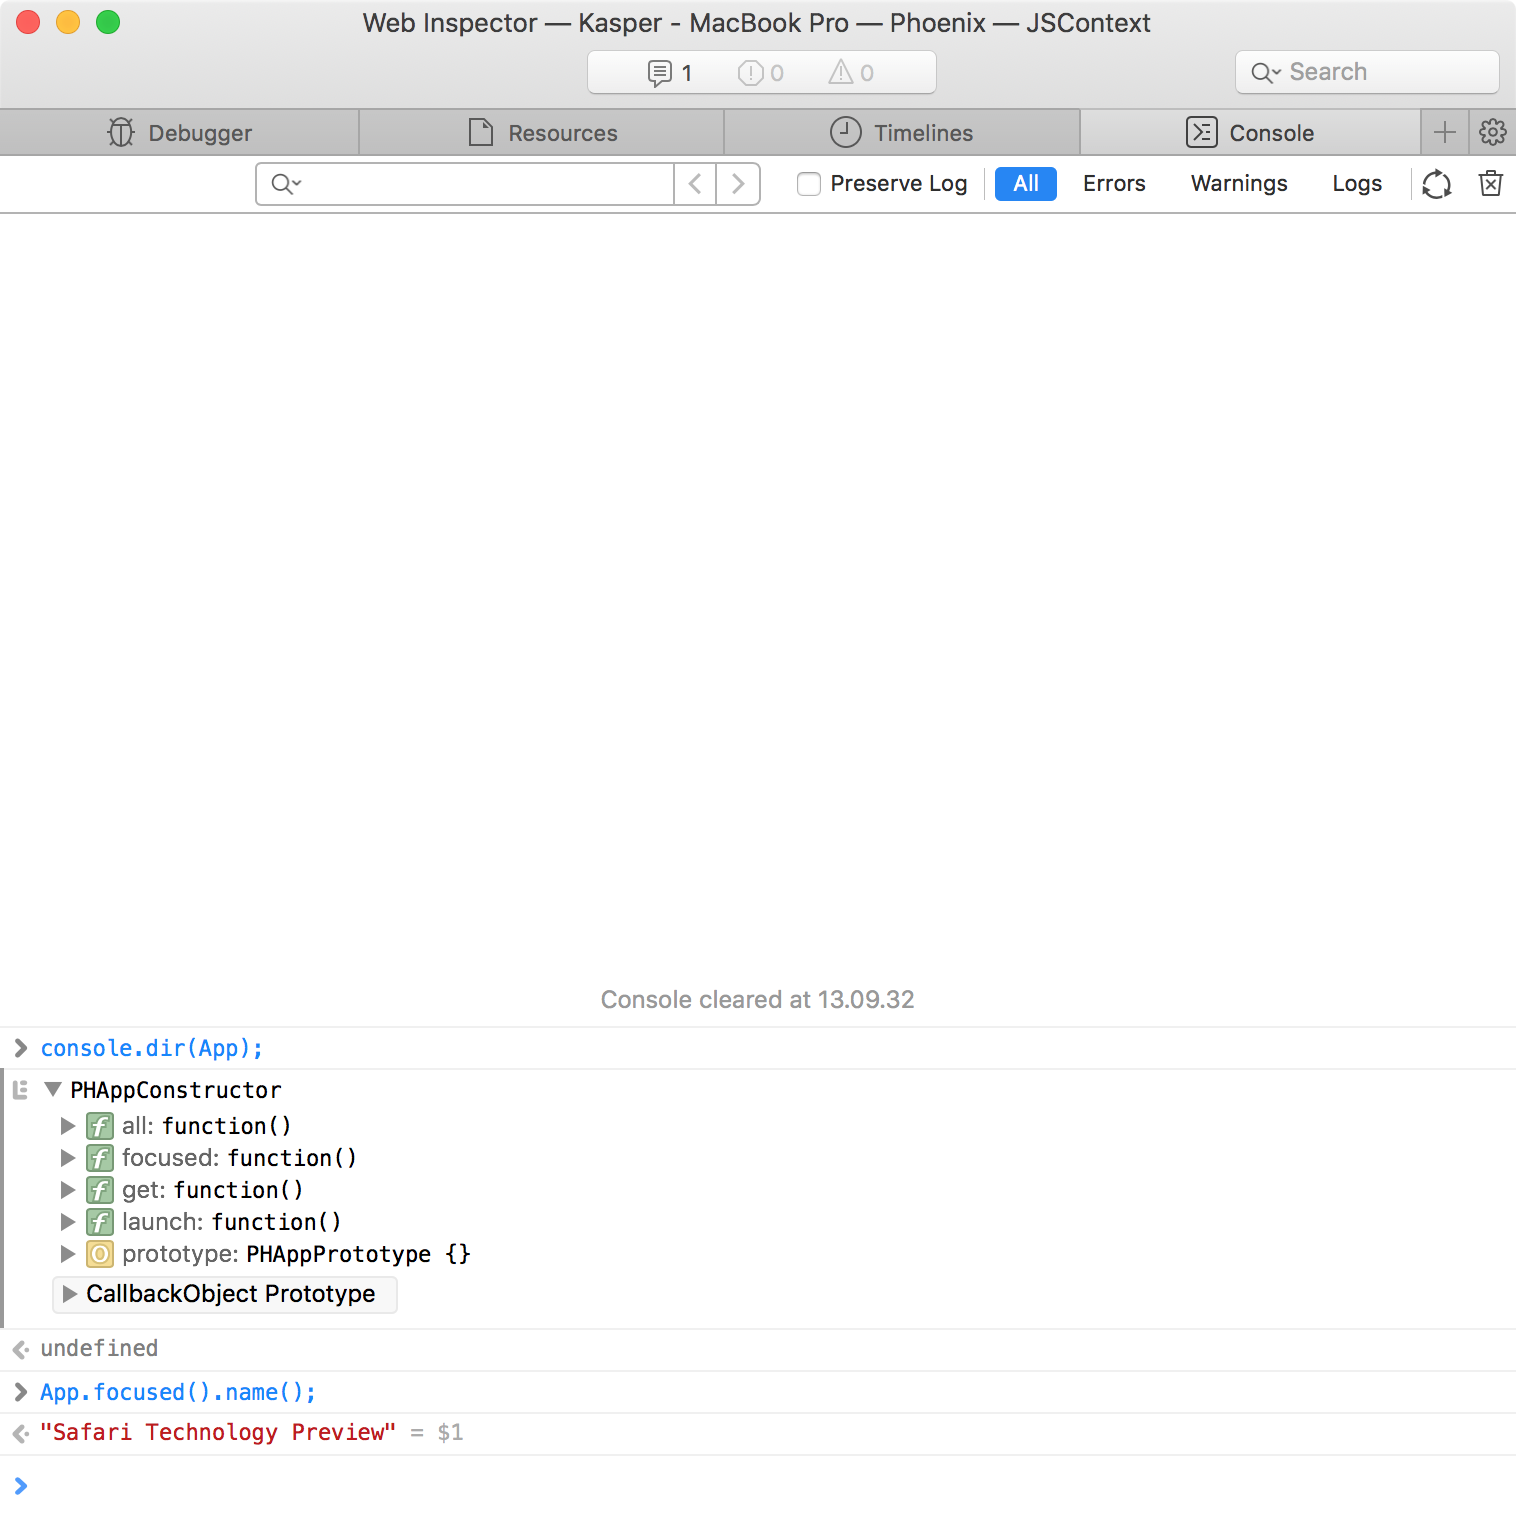
- Open the “Console” tab and start exploring
- Make Safari open the Web Inspector automatically when it detects a breakpoint in your configuration. To do this, open the “Develop” menu from Safari’s menu bar, find the menu item with the name of your device and hover over it.
- Select the option for “Automatically Show Web Inspector for JSContexts”
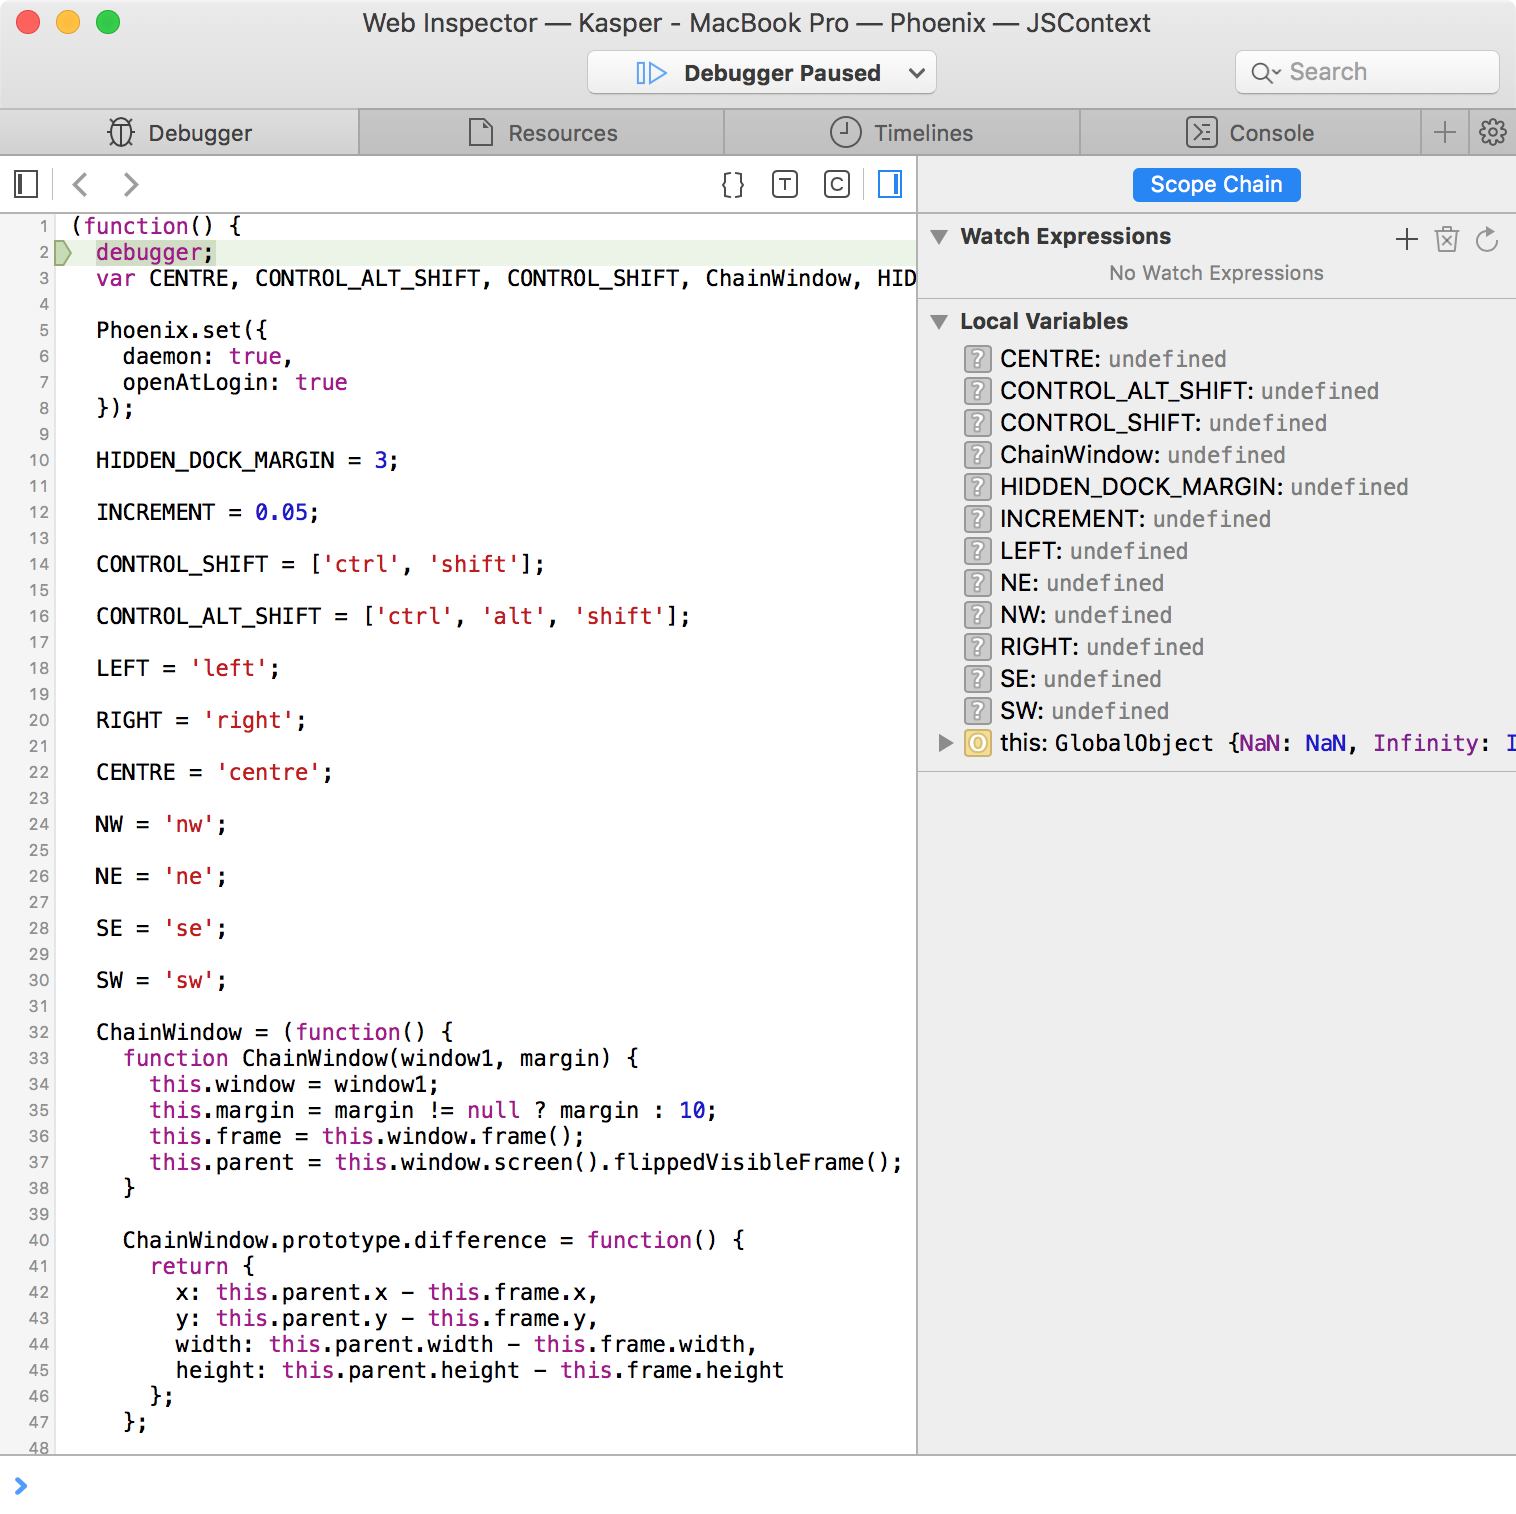
- Write the
debugger;statement somewhere in your configuration file, after Phoenix reloads the configuration, Web Inspector should open automatically and be paused on the breakpoint you set