Many parts of the city have different weather. But normally we consider temperatures measured by the weather reporting center, which is not specific to a particular area in the city but an average of the entire data collected.
The goal of Weather Mapping Studio is to graphically represent the different regions of city with different weather conditions for a particular time of the day or for a particular location at different times. For this, the data must be collected from different locations e.g. schools of the city, governmental organizations, NGO's and as many as possible with the help of a device/s like mobile, expEyes.
-
Weather Mapping studio is designed to graphically represent different regions of city with different weather conditions on real time maps for a particular time of the day or for a particular location at different times.
-
The data must be collected from different locations e.g. schools of the city with the help of a expEYES device. The project is going to extend this data collection from some countable institutes to many more by involving citizen’s to improve the accuracy.
-
Empowering citizen’s to upload weather data via two mobile apps one is J2ME and other is Android app. This can be installed on the handheld mobiles and converts mobiles into data reporting machine.
-
Project allows any user to visit site and check different graphical regions with its weather data. Also there is provision to view that weather data with the interactive graphs.
-
This project has wider scope in future which will cover various cities and weather parameters like temperature, humidity and wind velocity etc.
-
Also try is to implement the philosophy of free software where the code of project will be provided for free so any one can take and modify the code according to their need. That means this will be acting as “GENERIC” module for others.
-
Project’s main objective is to visualize weather data on real time maps. This should be achieve by graphically representing different regions of city with different weather conditions for a particular time of the day or for a particular location at different times.
-
The process of data acquisition should be facilitated by :
- expEYES device generated data.
- Android and Java enabled mobile devices via Android and J2ME applications.
- Web form to feed weather parameter data from site.
-
Data sent must be checked for its validity and correctness. Also data received must be stored in a database after cleansing. Care need to be taken that only cleansed, valid data should be store in the database.
-
If the particular location is not registered then there should be provision to register that location via web form.
-
Gathered data should be plotted on the map, which will give the better understanding of various weather parameters distributed geographically. There should be three views of map showing :
- "Live view", showing summarized weather data on click.
- Live view is all about to show real time data on a map; data like temperature, humidity, wind velocity etc at any location.
- "Marker view", showing various data points distribution on map.
- The marker view is used for plotting the markers on the location that are registered in the database and bind markers with their weather data.
- "Heat Map View", showing heat(temperature) and humidity.
- It is the represention of three dimentional data (x ,y co-ordinates and third dimention is intensity). When user click on HeatMap View it shows temperature data by default in red dark color and it plots latest temperature data of all registered location in database
-
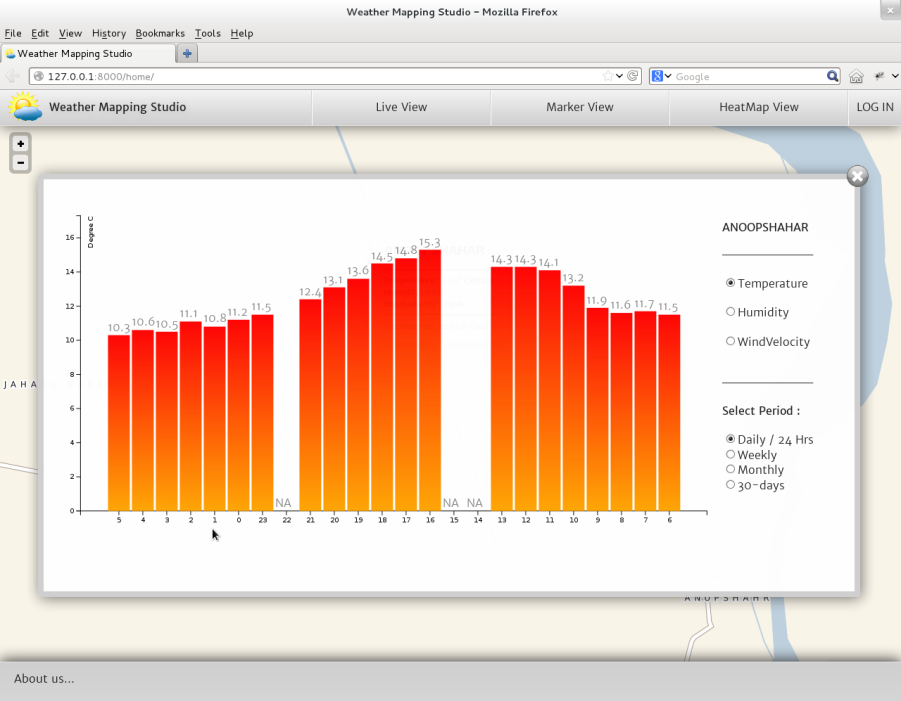
User should able to visualize data graphically. These graphs should take real time data from database and should change dynamically rather than being plain static graphs. There should be provision to plot graphs that covers various aspects/dimensions of data.
-
The technology used should be Open Source so that it can be act as generic model to be used and serve different needs, concepts of different peoples or institutions.
-
Front-End: HTML, CSS, JavaScript, jQuery, AJAX, D3.js, Leaflet.js, Heatmap.js
-
Back-End : Python, Django, SQLite, JSON, GNOWSYS
-
Mobile Platform: Android, J2ME
More screenshot's are available at this link