VS Code Extensions
The KIELER project provides two VS Code extensions:
- KLighD VS Code (from VS Code Marketplace or Open VSX Marketplace)
- KIELER VS Code, aka. keith-vscode (from VS Code Marketplace or Open VSX Marketplace)
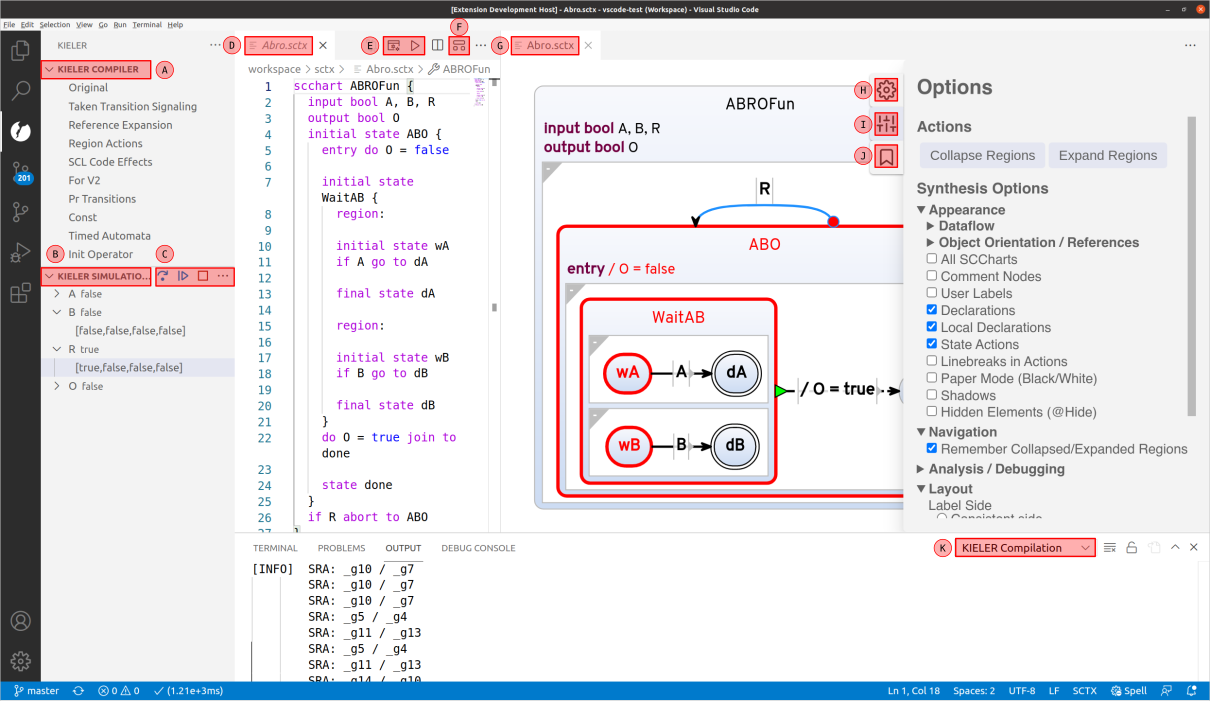
which provide a diagram view (D) with several options (E) and a language server with compilation and simulation support.
The language server provided by KIELER VS Code is consumed by klighd-vscode to also work as a diagram server.
VS Code extensions: Download the extensions from one of the official marketplaces, see KLighD in VS Code Marketplace, KLighD in Open VSX Marketplace, KIELER from VS Code Marketplace, and KIELER from Open VSX Marketplace
Install the extensions directly via the Extensions view in your VS Code by searching for the IDs kieler/klighd-vscode and kieler/keith-vscode or download the two vsix files directly and install them in your VS Code via
Install from VSIX in the view title menu of your Extensions view.
Open a workspace or a folder that contains the files you want to work on.
Open a supported file such as a '.strl', '.lus', 'elkt', 'kgt', or 'sctx' file in your workspace. As a next step should open the diagram view via Open in Diagram the editor context menu (i.e. right click on the editor) or the editor title menu (F) (big bar on top with two small bars below on the top right of your active editor with a supported file type).
The KIELER view container can be opened by right-clicking the sidebar and selecting KIELER or by View>Open View...>KIELER via the menu.
The current model in the current editor can be compiled by entering Compile current model with... in the command palette (F1 or ctrl+shift + p). Alternatively, this command can be accessed by clicking on the compile icon (E) in the editor title menu (file with cogs on the top right of the active editor).
The current model in the current editor can be simulated by entering Simulate current model with... in the command palette (F1). Alternatively, this command can be accessed by clicking on the simulate icon (E) in the editor title menu (play button). During simulation the current state is marked in red and taken transitions as well as states that were left are marked in blue.
As a result a quickpick menu opens that allows to select the desired compilation chain. The result of the selected compilation is shown the the diagram view (G). All different compilation snapshots can be seen in the KIELER Compiler tree-view (A) in the KIELER view container.
Note that you can compile with a simulation system, e.g. Netlist-based Simulation (C). The result can be simulated by clicking the play button in the diagram view.
The current model in the current editor can be simulated by entering Simulate current model with... in the command palette (F1). Alternatively, this command can be accessed by clicking on the simulation icon (E) in the editor title menu (play button on the top right of the active editor).
As a result a quickpick menu opens that allows to select the desired simulation chain. After selecting a simulation chain the simulation is executed. All inputs and outputs can be seen in the KIELER simulation tree-view. Next to each variable the current value is displayed (at start the current value is not defined and is, therefore, not visible). By clicking on a variable, the history of their values open. One can change an input value by either clicking on their history or via the context menu (right-click) of the item. This opens a command palette dialog to change to value.
The simulation controls (C) (step, pause, run) are accessible via the view title menu of the KIELER simulation view (B). The three dots in the simulation title menu (C) allow to export or import the trace as well allow to show the simulation visualization (*.kviz) in an external browser.
All infos, warnings, and errors that occur during compilation or simulation are logged to the corresponding KIELER output channels (K).
The diagram settings view (H), the diagram options view (I), which is opened in the screenshot, and the bookmark view (J), which allows to jump to specific viewports in the diagram that were saved earlier, allow to further configure the shown diagram.
See Modeling SCCharts for details.
Problem: The exported SVG does have incorrect font sizes.
Solution: Your SVG viewer does not support embedded fonts. Install the fonts Overpass and Overpass-Mono fonts from here. Exporting your SVG via inkscape should not run into this problem.
Problem: The trace file is not saved.
Solution: The extension of the trace file has to be .ktrace otherwise it does not work (might be fixed soon).
An SCChart has to be saved as an .sctx file to be recognized as an SCChart.
- Basic Syntax
- Annotations and Pragmas
- Dataflow
- Hostcode
- Timed Automata
- Object Orientation
- LEGO Mindstorms
- Developer Eclipse Setup with Oomph
- Semantics Release Process
- Build KIELER without Eclipse
- Automated Tests and Benchmarks
- Simulation Visualization (KViz)
- Legacy .sct Models
- Simulation Visualization (KViz)
- KiCo Tutorial
![]()
![]()