
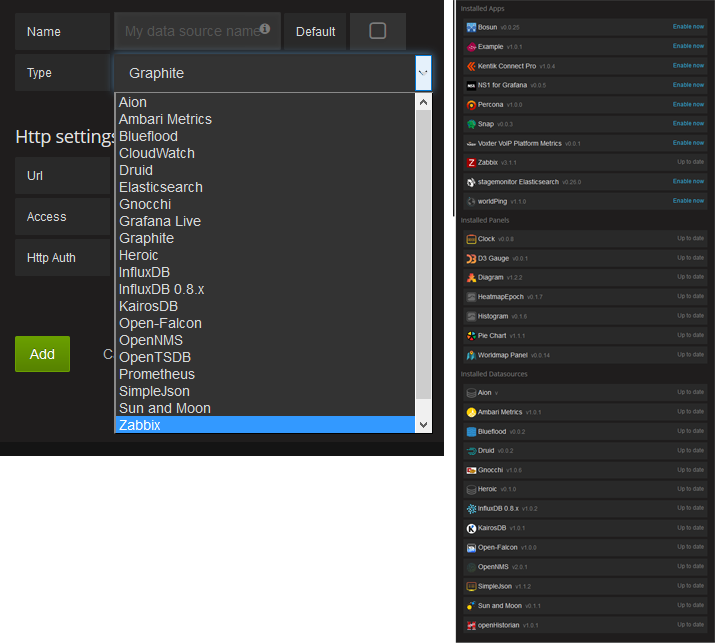
Official Grafana with all preinstalled plugins from https://grafana.net/plugins.
Please donate to author, so he can continue to publish another awesome projects for free:

Start your image binding the external port 3000:
docker run -d --name=grafana-xxl -p 3000:3000 monitoringartist/grafana-xxl:latest
Try it out, default admin user is admin/admin.
# create /var/lib/grafana as persistent volume storage
docker run -d -v /var/lib/grafana --name grafana-xxl-storage busybox:latest

# start grafana-xxl
docker run \
  -d \
  -p 3000:3000 \
  --name grafana-xxl \
  --volumes-from grafana-xxl-storage \
  monitoringartist/grafana-xxl:latest
# specify right tag, e.g. 2.6,3.1,dev (latest nigthly build) - see Docker Hub for available tags
docker run \
  -d \
  -p 3000:3000 \
  --name grafana-xxl \
  monitoringartist/grafana-xxl:dev
All options defined in conf/grafana.ini can be overriden using environment variables, for example:
docker run \
  -d \
  -p 3000:3000 \
  --name=grafana-xxl \
  -e "GF_SERVER_ROOT_URL=http://grafana.server.name" \
  -e "GF_SECURITY_ADMIN_PASSWORD=secret" \
  monitoringartist/grafana-xxl:latest
docker run \
  -d \
  -p 3000:3000 \
  --name=grafana-xxl \
  -e "GF_AWS_PROFILES=default" \
  -e "GF_AWS_default_ACCESS_KEY_ID=YOUR_ACCESS_KEY" \
  -e "GF_AWS_default_SECRET_ACCESS_KEY=YOUR_SECRET_KEY" \
  -e "GF_AWS_default_REGION=eu-west-1" \
  monitoringartist/grafana-xxl:latest
You may also specify multiple profiles to GF_AWS_PROFILES (e.g.
GF_AWS_PROFILES=default another).
Supported variables:
GF_AWS_PROFILES: list of AWS profiles for Cloudwatch datasourceGF_AWS_${profile}_ACCESS_KEY_ID: AWS access key ID (required).GF_AWS_${profile}_SECRET_ACCESS_KEY: AWS secret access key (required).GF_AWS_${profile}_REGION: AWS region (optional).
Container tries to upgrade all installed plugins in the container automatically before Grafana start. If you want to disable this behaviour, please use environment variable -e UPGRADEALL=false.
- Puppet for dockerized grafana-xxl
- Ansible for dockerized grafana-xxl
- docker-compose for dockerized grafana-xxl
Devops Monitoring Expert, who loves monitoring systems, which start with letter Z. Those are Zabbix and Zenoss.
Professional devops / monitoring services:
[]
(http://www.monitoringartist.com 'DevOps / Docker / Kubernetes / AWS ECS / Google GCP / Zabbix / Zenoss / Terraform / Monitoring')