| id | title | description | hide_table_of_contents | keywords | image | |||||
|---|---|---|---|---|---|---|---|---|---|---|
running-tracetest-without-a-trace-data-store-with-manual-instrumentation |
Node.js and OpenTelemetry Manual Instrumentation |
Quick start how to configure a Node.js app to use OpenTelemetry manual instrumentation with traces, and Tracetest for enhancing your E2E and integration tests with trace-based testing. |
false |
|
:::note Check out the source code on GitHub here. :::
Tracetest is a testing tool based on OpenTelemetry that allows you to test your distributed application. It allows you to use data from distributed traces generated by OpenTelemetry to validate and assert if your application has the desired behavior defined by your test definitions.
This is a simple quick start on how to configure a Node.js app to use OpenTelemetry instrumentation with traces, and Tracetest for enhancing your E2E and integration tests with trace-based testing. This example includes manual instrumentation and a sample bookstore array that simulates fetching data from a database.
You will need Docker and Docker Compose installed on your machine to run this quick start app!
The project is built with Docker Compose. It contains two distinct docker-compose.yaml files.
The docker-compose.yaml file and Dockerfile in the root directory are for the Node.js app.
The docker-compose.yaml file, collector.config.yaml, tracetest-provision.yaml, and tracetest.config.yaml in the tracetest directory are for the setting up Tracetest and the OpenTelemetry Collector.
The tracetest directory is self-contained and will run all the prerequisites for enabling OpenTelemetry traces and trace-based testing with Tracetest.
All services in the docker-compose.yaml are on the same network and will be reachable by hostname from within other services. E.g. tracetest:4317 in the collector.config.yaml will map to the tracetest service, where the port 4317 is the port where Tracetest accepts traces.
The Node.js app is a simple Express app with two microservices, contained in the app.js and availability.js files.
The OpenTelemetry tracing is contained in the tracing.otel.grpc.js or tracing.otel.http.js files, respectively.
Traces will be sent to the OpenTelemetry Collector.
Here's the content of the tracing.otel.grpc.js file:
const opentelemetry = require("@opentelemetry/sdk-node");
const {
  getNodeAutoInstrumentations,
} = require("@opentelemetry/auto-instrumentations-node");
const {
  OTLPTraceExporter,
} = require("@opentelemetry/exporter-trace-otlp-grpc");
const { Resource } = require("@opentelemetry/resources");
const {
  SemanticResourceAttributes,
} = require("@opentelemetry/semantic-conventions");
const { NodeTracerProvider } = require("@opentelemetry/sdk-trace-node");
const { BatchSpanProcessor } = require("@opentelemetry/sdk-trace-base");

const resource = Resource.default().merge(
  new Resource({
    [SemanticResourceAttributes.SERVICE_NAME]:
      "quick-start-nodejs-manual-instrumentation",
    [SemanticResourceAttributes.SERVICE_VERSION]: "0.0.1",
  })
);

const provider = new NodeTracerProvider({ resource: resource });
const exporter = new OTLPTraceExporter({ url: "http://otel-collector:4317" });
const processor = new BatchSpanProcessor(exporter);
provider.addSpanProcessor(processor);
provider.register();

const sdk = new opentelemetry.NodeSDK({
  traceExporter: exporter,
  instrumentations: [getNodeAutoInstrumentations()],
  serviceName: "quick-start-nodejs-manual-instrumentation",
});
sdk.start();
Depending on which of these you choose, traces will be sent to either the grpc or http endpoint.
The hostnames and ports for these are:
- GRPC:
http://otel-collector:4317 - HTTP:
http://otel-collector:4318/v1/traces
Enabling the tracer is done by preloading the trace file.
node -r ./tracing.otel.grpc.js app.jsIn the package.json you will see two npm scripts for running the respective tracers alongside the app.js.
"scripts": {
  "app-with-grpc-tracer": "node -r ./tracing.otel.grpc.js app.js",
  "app-with-http-tracer": "node -r ./tracing.otel.http.js app.js",
  "availability-with-grpc-tracer": "node -r ./tracing.otel.grpc.js availability.js",
  "availability-with-http-tracer": "node -r ./tracing.otel.http.js availability.js"
},
To start the app.js Express server, run this command:
npm run app-with-grpc-tracer
# or
npm run app-with-http-tracer
To start the availability.js Express server, run this command:
npm run availability-with-grpc-tracer
# or
npm run availability-with-http-tracer
As you can see the Dockerfile does not have a CMD section.
FROM node:slim
WORKDIR /usr/src/app
COPY package*.json ./
RUN npm install
COPY . .
EXPOSE 8080
Instead, the docker-compose.yaml contains the CMD section for both services.
version: "3"
services:
  app:
    image: quick-start-nodejs
    build: .
    command: npm run app-with-grpc-tracer
    ports:
      - "8080:8080"
  availability:
    image: quick-start-nodejs-availability
    build: .
    command: npm run availability-with-grpc-tracer
    ports:
      - "8080"
To start it, run this command:
docker compose build # optional if you haven't already built the image
docker compose up
This will start the Node.js app. But, you're not sending the traces anywhere.
Let's fix this by configuring Tracetest and OpenTelemetry Collector.
The docker-compose.yaml in the tracetest directory is configured with three services.
- Postgres - Postgres is a prerequisite for Tracetest to work. It stores trace data when running the trace-based tests.
- OpenTelemetry Collector - A vendor-agnostic implementation of how to receive, process and export telemetry data.
- Tracetest - Trace-based testing that generates end-to-end tests automatically from traces.
version: "3"
services:
  tracetest:
    image: kubeshop/tracetest:latest
    platform: linux/amd64
    volumes:
      - type: bind
        source: ./tracetest/tracetest-config.yaml
        target: /app/tracetest.yaml
      - type: bind
        source: ./tracetest/tracetest-provision.yaml
        target: /app/provisioning.yaml
    ports:
      - 11633:11633
    command: --provisioning-file /app/provisioning.yaml
    depends_on:
      postgres:
        condition: service_healthy
      otel-collector:
        condition: service_started
    healthcheck:
      test: ["CMD", "wget", "--spider", "localhost:11633"]
      interval: 1s
      timeout: 3s
      retries: 60
    environment:
      TRACETEST_DEV: ${TRACETEST_DEV}

  postgres:
    image: postgres:14
    environment:
      POSTGRES_PASSWORD: postgres
      POSTGRES_USER: postgres
    healthcheck:
      test: pg_isready -U "$$POSTGRES_USER" -d "$$POSTGRES_DB"
      interval: 1s
      timeout: 5s
      retries: 60

  otel-collector:
    image: otel/opentelemetry-collector-contrib:0.59.0
    command:
      - "--config"
      - "/otel-local-config.yaml"
    volumes:
      - ./tracetest/collector.config.yaml:/otel-local-config.yaml
Tracetest depends on both Postgres and the OpenTelemetry Collector. Both Tracetest and the OpenTelemetry Collector require config files to be loaded via a volume. The volumes are mapped from the root directory into the tracetest directory and the respective config files.
To start both the Node.js services and Tracetest we will run this command:
docker-compose -f docker-compose.yaml -f tracetest/docker-compose.yaml up # add --build if the images are not built alreadyThe tracetest-config.yaml file contains the basic setup of connecting Tracetest to the Postgres instance.
postgres:
  host: postgres
  user: postgres
  password: postgres
  port: 5432
  dbname: postgres
  params: sslmode=disable
The tracetest-provision.yaml file provisions the trace data store and polling to store in the Postgres database. The data store is set to OTLP meaning the traces will be stored in Tracetest itself.
---
type: PollingProfile
spec:
  name: Default
  strategy: periodic
  default: true
  periodic:
    retryDelay: 5s
    timeout: 10m

---
type: DataStore
spec:
  name: OpenTelemetry Collector
  type: otlp
  default: true
But how are traces sent to Tracetest?
The collector.config.yaml explains that. It receives traces via either grpc or http. Then, exports them to Tracetest's OLTP endpoint tracetest:4317.
receivers:
  otlp:
    protocols:
      grpc:
      http:

processors:
  batch:
    timeout: 100ms

exporters:
  logging:
    loglevel: debug
  otlp/1:
    endpoint: tracetest:4317
    # Send traces to Tracetest.
    # Read more in docs here: https://docs.tracetest.io/configuration/connecting-to-data-stores/opentelemetry-collector
    tls:
      insecure: true

service:
  pipelines:
    traces/1:
      receivers: [otlp]
      processors: [batch]
exporters: [otlp/1]To start both the Node.js services and Tracetest we will run this command:
docker-compose -f docker-compose.yaml -f tracetest/docker-compose.yaml up # add --build if the images are not built alreadyThis will start your Tracetest instance on http://localhost:11633/.
Open the URL and start creating tests in the Web UI! Make sure to use the http://app:8080/books URL in your test creation, because your Node.js app and Tracetest are in the same network.
Here's a sample of a failed test run, which happens if you add this assertion:
attr: books.list.count = 4;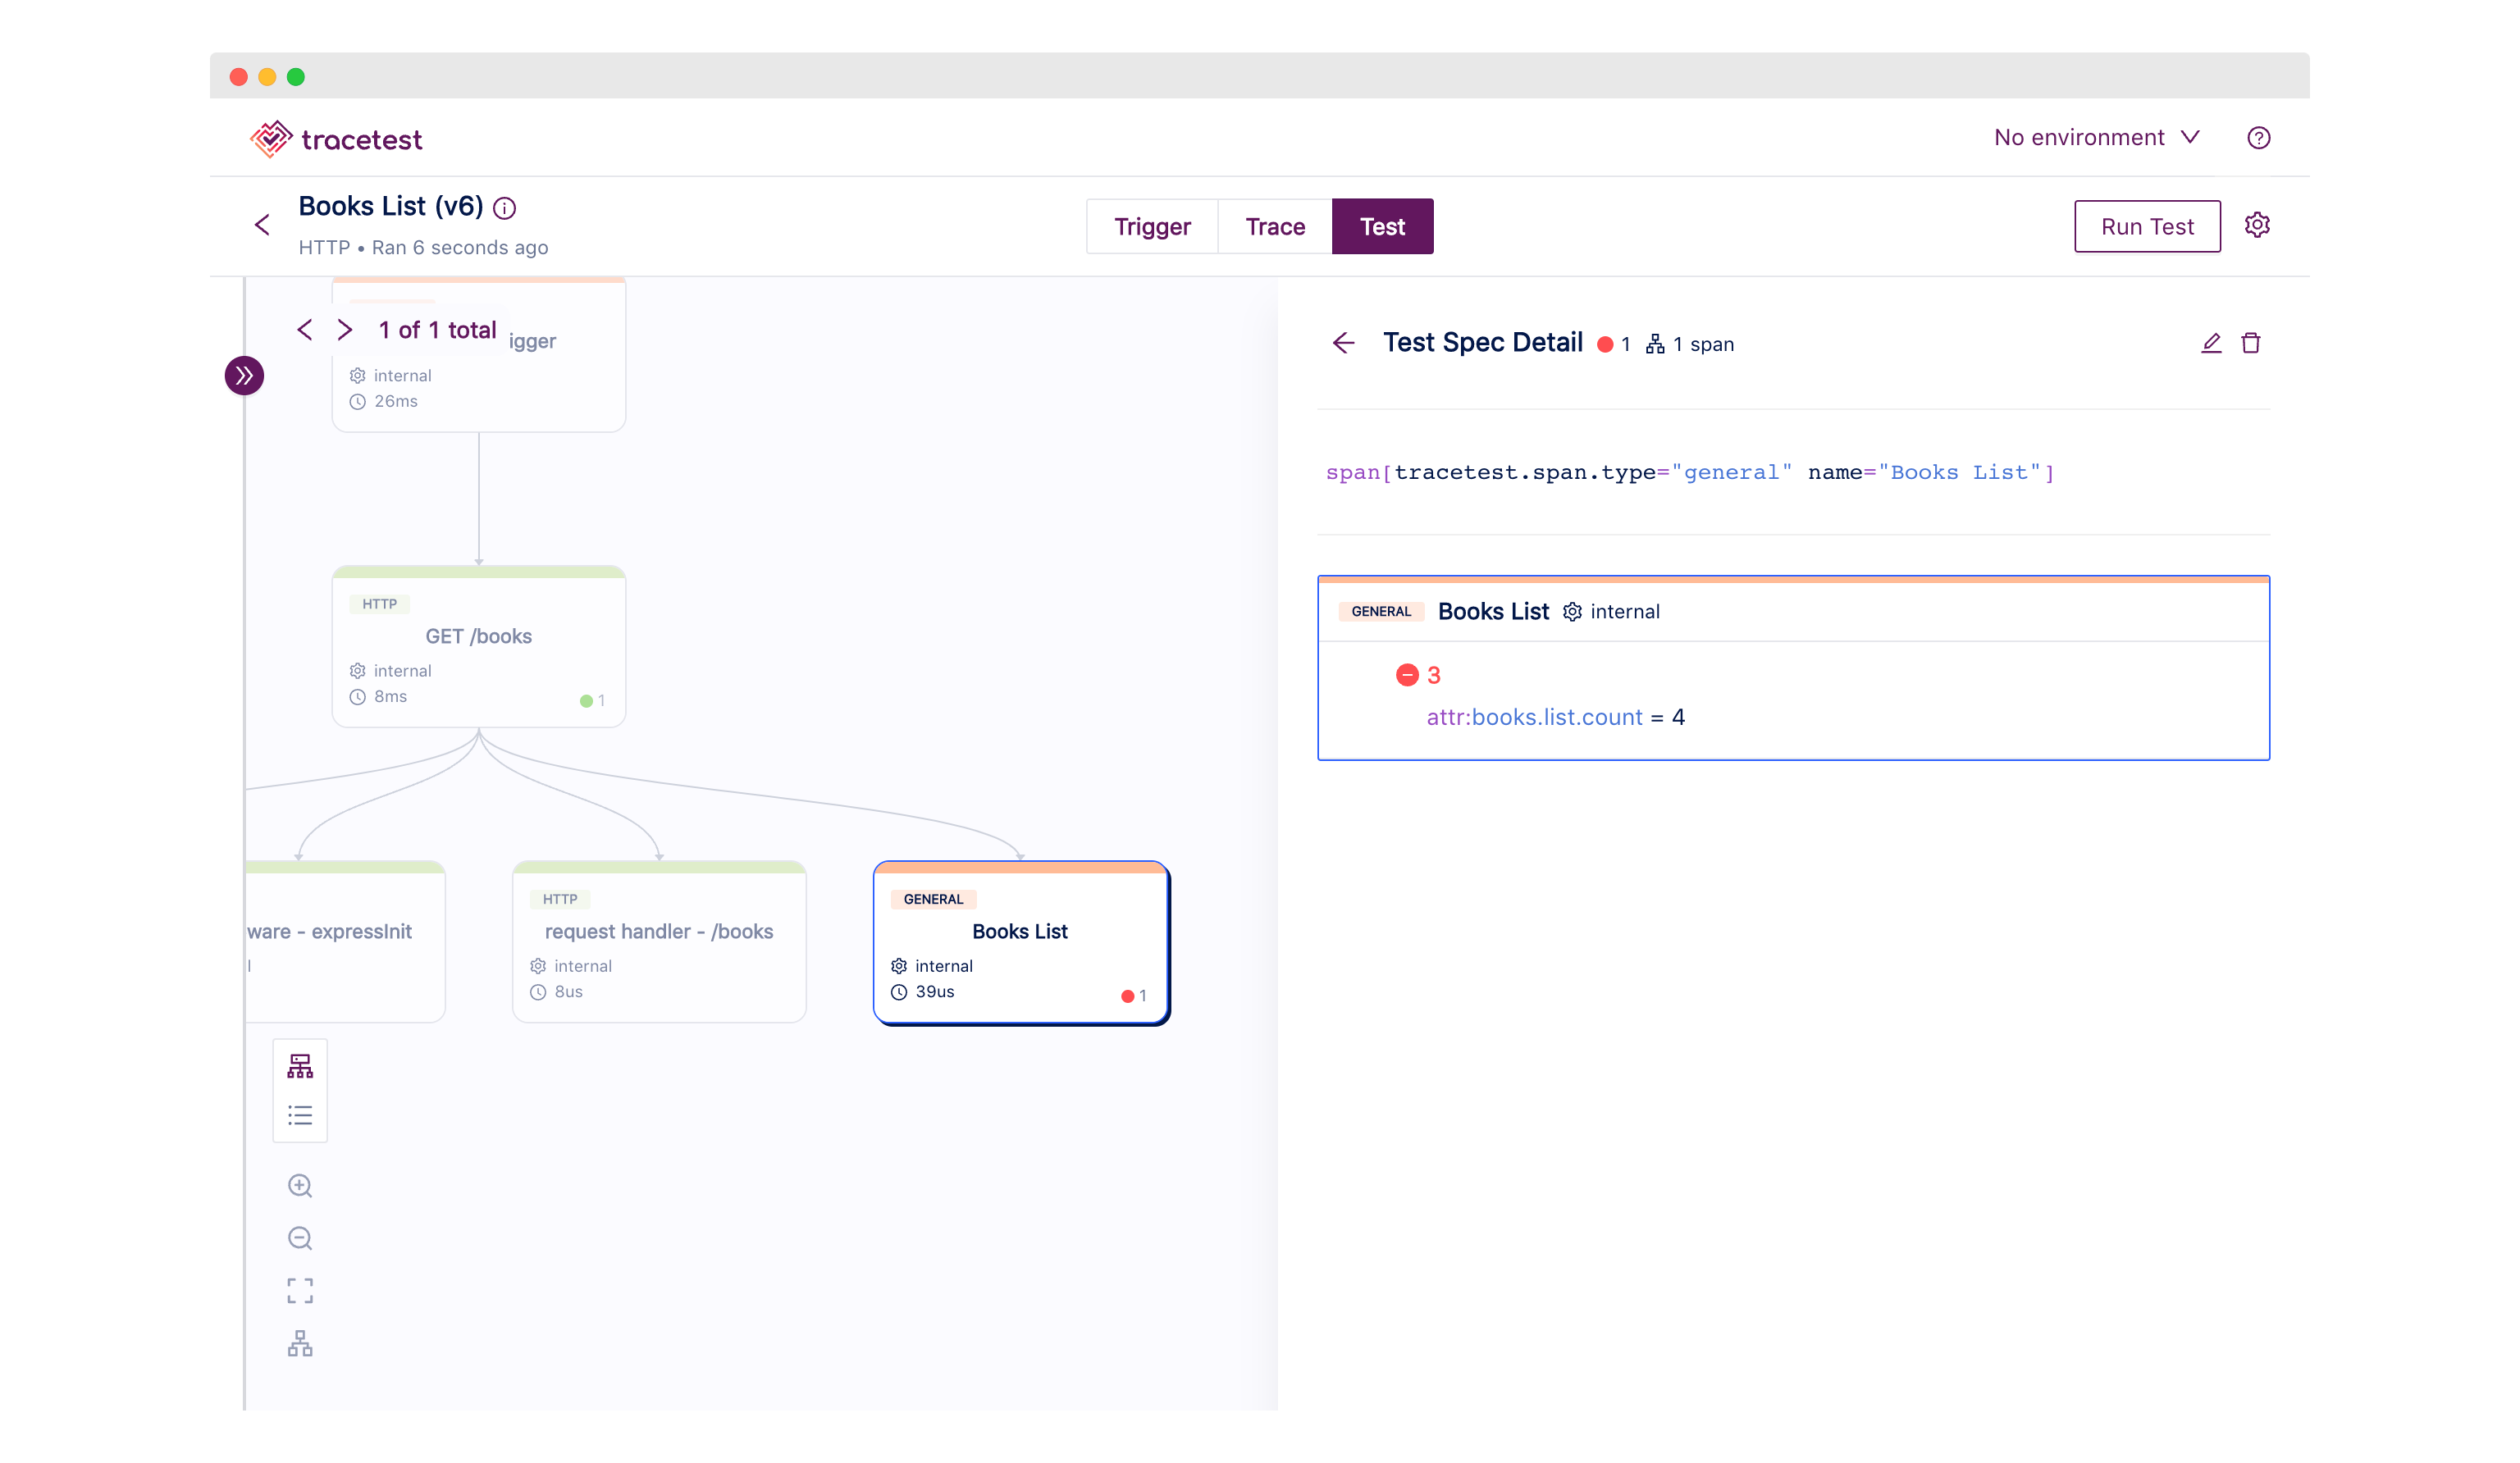
It fails because of the books.length is equal to 3.
First, install the CLI. Then, configure the CLI:
tracetest configure --server-url http://localhost:11633Once configured, you can run a test against the Tracetest instance via the terminal.
Check out the test-api.yaml file.
type: Test
spec:
  id: W656Q0c4g
  name: Books List
  description: List of books
  trigger:
    type: http
    httpRequest:
      url: http://app:8080/books
      method: GET
      headers:
        - key: Content-Type
          value: application/json
  specs:
    - selector: span[tracetest.span.type="http" name="GET /books" http.target="/books" http.method="GET"]
      assertions:
        - attr:http.status_code = 200
    - selector: span[tracetest.span.type="general" name="Books List"]
      assertions:
        - attr:books.list.count = 4
This file defines the a test the same way you would through the Web UI.
To run the test, run this command in the terminal:
tracetest run test -f ./test-api.yamlThis test will fail just like the sample above due to the attr:books.list.count = 4 assertion.
✘ http://app:8080 (http://localhost:11633/test/W656Q0c4g/run/5/test)
	✔ span[tracetest.span.type="http" name="GET /books" http.target="/books" http.method="GET"]
		✔ #994c63e0ea35e632
			✔ attr:http.status_code = 200 (200)
	✘ span[tracetest.span.type="general" name="Books List"]
		✘ #5ab1856c32b0d5c8
			✘ attr:books.list.count = 4 (3) (http://localhost:11633/test/W656Q0c4g/run/5/test?selectedAssertion=1&selectedSpan=5ab1856c32b0d5c8)
The tests will pass if you change the assertion to:
attr: books.list.count = 3;Feel free to check out our docs and join our Slack Community for more info!