

1-Open Firefox, Chrome, or Safari and navigate to https://www.arcgis.com/index.html in the web browser.
2-Click the blue Sign In button in the middle of the page.
3-Log in by creating a free account or using your institutional logins.


4-Once logged in, click on Content in the menu on the top-left of the page.

5-Once in Content, click on Create-Map to start building an interactive online map.

6-Add a title, tags, and summary, and click the blue OK icon.

7-You are now in ArcGIS Online’s map builder interface.
8-Download the SampleData.csv file from this repo.
Guide for saving an Excel file as a CSV.

9-Click on the Add icon in the top-left corner of the page, and select Add Layer from File.
10-Click the Browse icon and select the CSV file saved to your Desktop.

11-Click the blue Import Layer icon to add the data to your map.

12-Click the blue Done icon to finish adding data to your map.

13-Click the Save icon above the map to save your map.
Note: This rest of this tutorial is written using a sample data set. Your data, map, and map layers will look different than the images included in the tutorial.
The default setting for ArcGIS Online is to display the locations in your data without any styling or customization. Hover your cursor over the data layer to see additional customization options. You can use multiple layers to display or highlight different aspects of the data on the map.

You can change the background map by click a different option in the Basemap dropdown.

If you want to style points by location, emotion, or another attribute, click on the Change Style icon. Choose an element from your data, and explore the drawing style options.


Click on the Change Style icon, and click the blue Options icon.
You can create a Heat Map in the Change Style window.
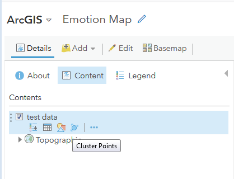
You can also cluster points using the Cluster Points option in the main map editing window.


Hover your cursor over the data layer and click the three dots that appear.
Click on the Configure Pop-up option to select what data fields display in the pop-up window that appears when you click on a map point. You can also reorder these elements.
Hover your cursor over the data layer and click the three dots that appear to see additional options for customizing transparency, copying a layer, or naming a layer.
14-Work as a group to explore display options for your data. One layer does not have to communicate all relevant aspects of the data.

15-Once you have a layer customized, you can copy that layer to continue exploring other display options without losing the customized layer.
16-Rename layers using descriptive titles to keep them organized.
17-Save the Web Map regularly to avoid losing any changes.
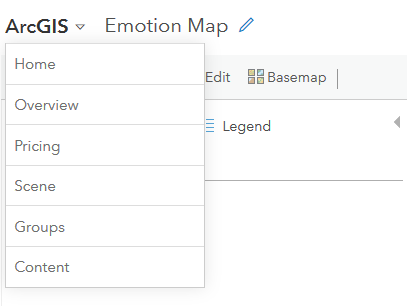
18-Click on the ArcGIS icon in the top left corner, and return to the Content page.

19-The map you created will now appear as a content item.
20-Click on the Web Map item.
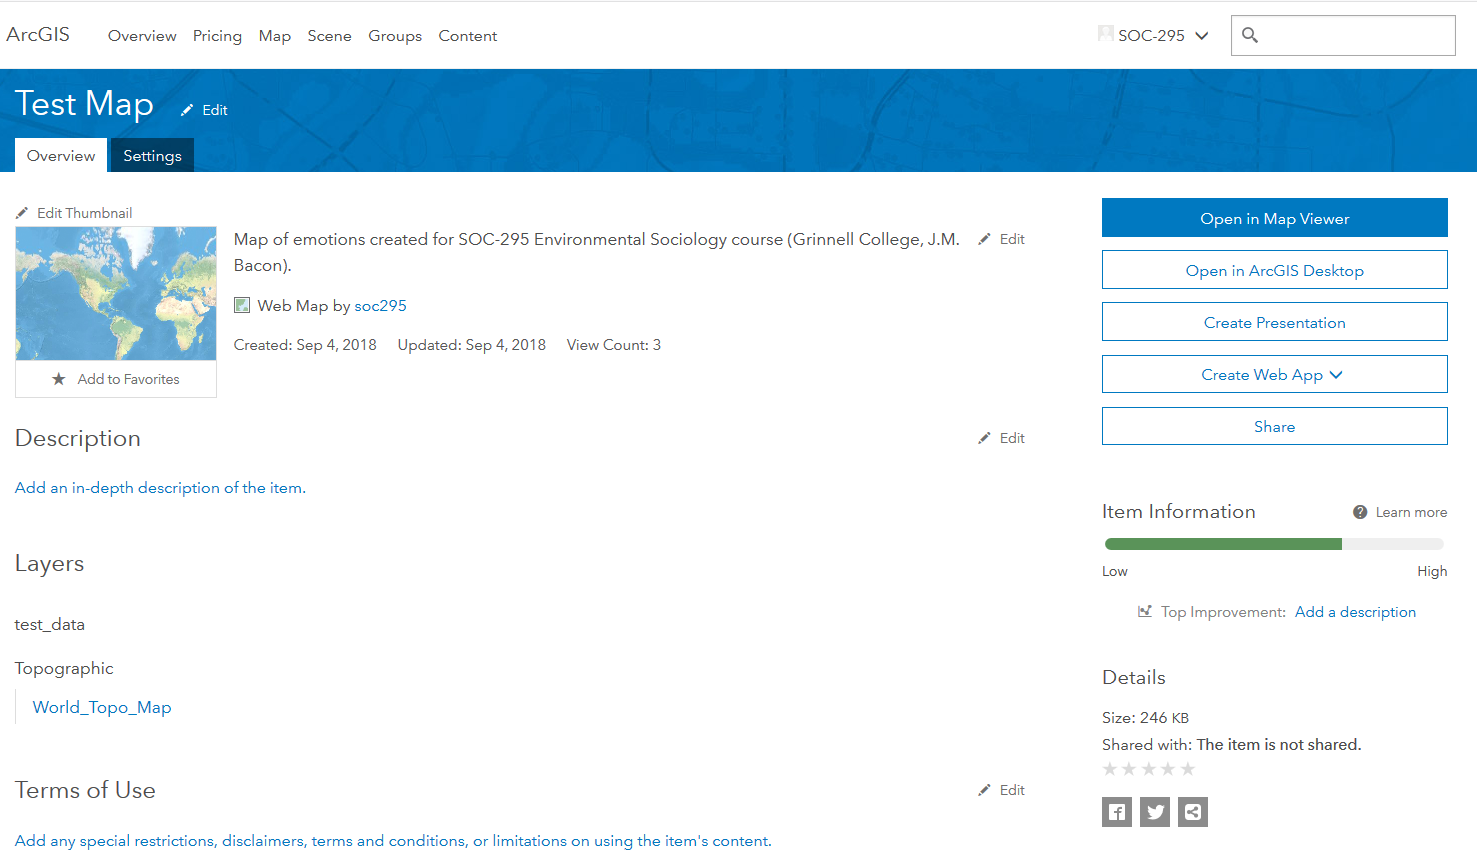

21-Click on Create Web App—Using a Template
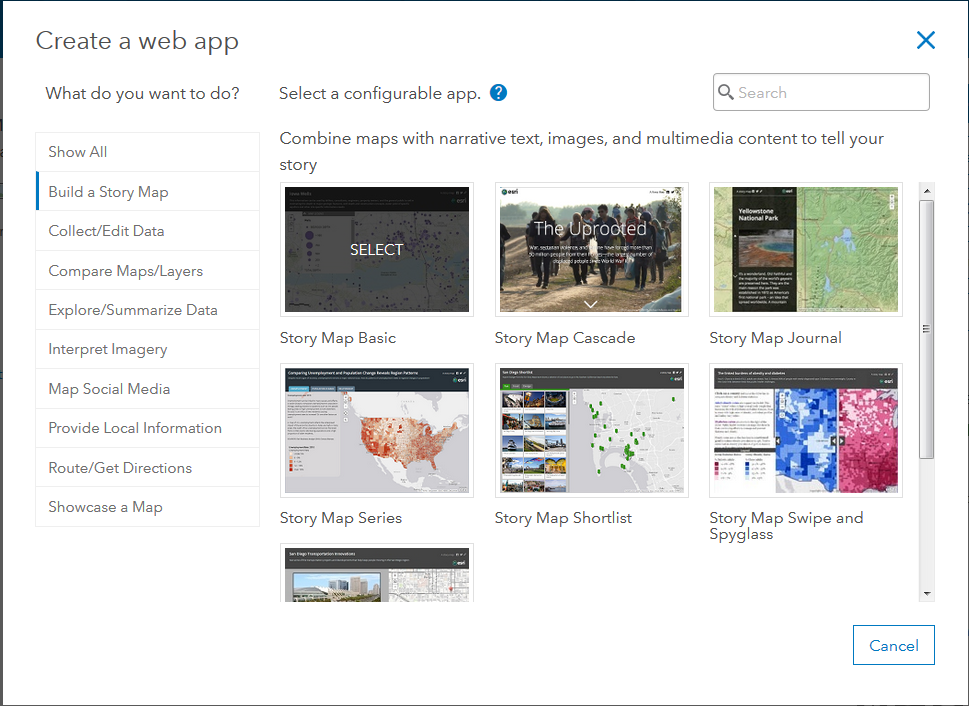

22-Click on Build a Story Map, and select Story Map Series.
23-Click the blue Create Web App icon to start customizing your web application.

24-ArcGIS will automatically use the title, tags, and summary from your Web Map. You can change any of these fields if needed, then click Done.
Share the interactive map your group created.
- What aspects of the data are highlighted?
- What does your interactive map communicate about the data?
- What could a user learn from your interactive map?
- Other ideas for how you might want to design or continue building the interactive map?
Even though we are using an ArcGIS Online template, you still have a range of options for building and customizing your interactive map.
Based on the map layers you created in ArcGIS Online, what aspects of the data do you want to highlight?What do different map layers communicate about the data?
What do you think is important to communicate about the data?
Explore the gallery of web applications built using this template to imagine possible design and content choices. Are there other templates you might be interested in exploring?
Let the notes from the design brainstorm guide as you build out the interactive map.
*Note: This tutorial outlines steps for building one type of interactive map template, in order to show the basic functionality and editing features of ArcGIS Online. You may decide a different template is the best fit for your project. The specifics of that template will be different from what you're seeing here, but the basic features and functionality will likely have some overlap.

Like you saw in the gallery, this template offers Tabbed, Side Accordion, or Bulleted layout options.

You can customize other layout settings like color scheme under Settings.


For any of the layout options, you can bring in layers from the Web Map you created in previous sections of this tutorial. Customizing the map content display allows you to use the same Web Map and select specific players to display on a page.

For any of the layout options, you can include text or other multimedia content to accompany the map.

Leaving this panel blank will make it hidden (not visible) in the public map interface.
Click the blue Save icon in the top right-hand corner of the screen often to save changes to the project.
Click on View Story in the top menu to see what the public application interface will look like.
When done building and customizing the web application, save the project.
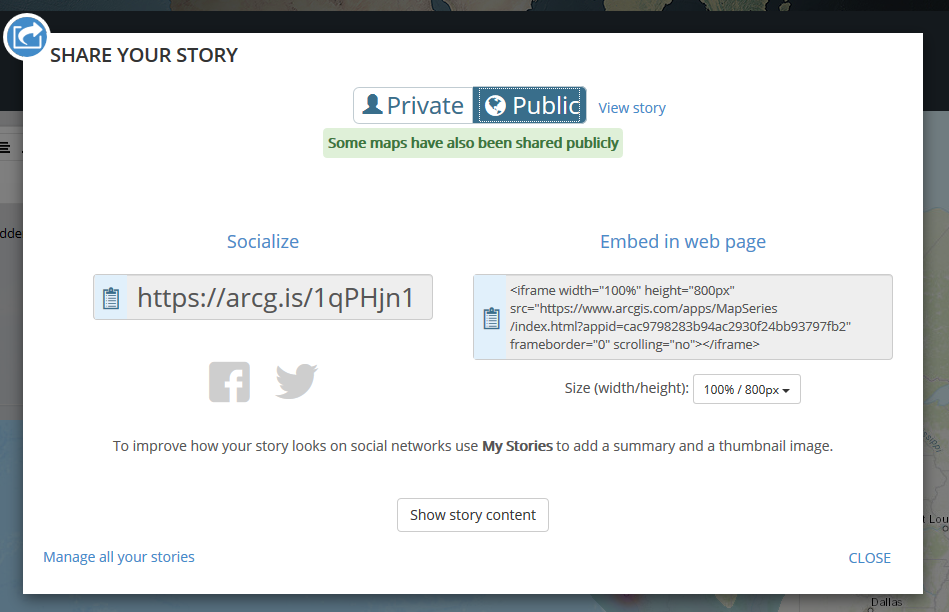
Click on Share in the top menu to publish your web application.