plotUlog is octave(open source equivalance of matlab) .m script package for plotting ULog files parsed and converted by pyulog.
ULog is a self-describing logging format which is documented here.
GNU Octave is powerful mathmatics software with built in plotting and visualization tools which runs on Linux, macOS, BSD and Windows. Tested on Octave 4.4.1 and later.
Please note plotUlog is tested under octave version 4.4.2 on ubuntu 16.04.
- Install octave on ubuntu
Add ppa to install 4.4.1 or later version of octave
$ sudo add-apt-repository ppa:octave/stable
$ sudo apt update
$ sudo apt install octave
Now Octave can be run from launch bar in ubuntu
- Install pyulog which will parse ULog file and convert to .csv files.
pyulog can be downloaded from here or visit https://github.com/PX4/pyulog
- clone plotulog git or download and unzip package in any folder.
Depending on the version of px4 firmware, ULog file can have different names.
In 1.8.0, ULog files are created as
/log/yyyy-mm-dd/hh_mm_ss.ulg
For convenience, change the .ulg file as
log###.ulg
Launch octave and go to the folder you just cloned or unzipped.
Copy a ULog file into the folder.
In octave terminal, enter
plotUlog("log###.ulg","Description")Description can be any of your choice for identifying the foldr.
plotUlog will call pyulog to create .csv files under ###_Description/ folder and start generating plots.
Once .csv files are created you can re-plot by entering the folder created from above.
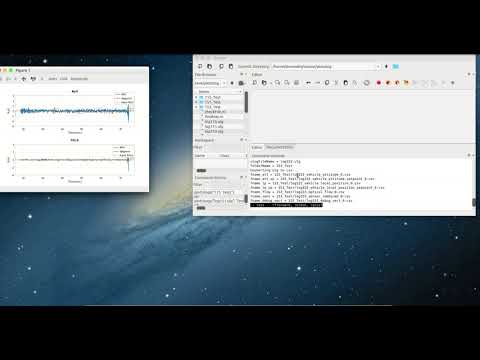
plotUlog("###_Description/")Once Ulog files successfully converted to csv file, you can compare two different sensor data each other by calling compareSensorLogs as below If you have csv files under "001_log" and "002_log", enter
compareSensorLogs("001_log/","002_log/")and you will get these plots which makes easier for comparing two different sensor data at the same time.

Many drones suffers from stability issues due to resonance vibrations from lots of unknown factors such as motors, mechanical configurations, unbalanced props and etc.
FFT analysis shows the resonance frequency and its magnitude and may gives an idea about what is causing the problem.
Thanks to the built in FFT functions in octave, you can anaylze accelerometer, gyro data in a designated folder by simply running the analyzeSensors as below.
If you have sensor_combined_0.csv file under "001_log" folder, enter
analyzeSensors("001_log/")Or if you want to specify range of the data to look at such as from 50.0 to 77.0, enter
analyzeSensors("001_log/",[50.0 77.0])
See what's inside the script file and manipulate any of data you want.
Octave script is similar to matlab code and easy to handle lots of data.