This library allows for loading Nanoscope v7.2 force-volume data and performing multipoint force-deflection (MFD) analysis. MFD is a local materials characterization technique that performs many force-deflection ramps on a microcantilever. The each force-deflection ramp is converted to a compliance value. The compliance data is fit to a fixed-free Euler beam and Young's modulus is extracted. pyMFD is the first software created for MFD analysis, as it is a new technique.
Detailed installation instructions are available in the documentation.
You can install pyMFD with pip:
$ pip install pyMFD
In order to run the tests, please install from source. The following installs the dependencies in a python virtual environment:
      $ git clone https://github.com/larsenkg/pyMFD.git
      $ cd pyMFD
      $ python -m venv env
      $ source env/bin/activate
(env) $ python -m pip install numpy==1.21.2 scipy==1.7.1 matplotlib==3.5.0 \
        bottleneck==1.3.2 pytest==7.1.2
(env) $ python -m pytest pyMFD/tests/
The documentation is available here.
The compliance map inspector allows for interactive exploration of the compliance map (left) and the force ramps (center) that make up each pixel of the compliance map. One can also view a map of
Example:
import matplotlib.pyplot as plt
from pyMFD.FV import FV
from pyMFD.summarize import comp_mat_inspector
from pyMFD.cantilever import calc_modulus

spm_file        = "data/examples/02041411.001"  # Example force-volume scan
fv              = FV(spm_file)                  # Load force-volume scan
(comp_mat, r2s) = fv.summarize()

# Interactive compliance map inspector
# Use mouse to select pixels in the (left) compliance map.
# The force ramp data is shown in the center plot.
# The R^2 map (how well the force-deflection data was fit) is shown in the right map.
comp_mat_inspector(
    comp_mat,
    fv.z_piezo,
    fv.get_retract(),
    fv.sc_params,
    r2s_mat = r2s
)
plt.show()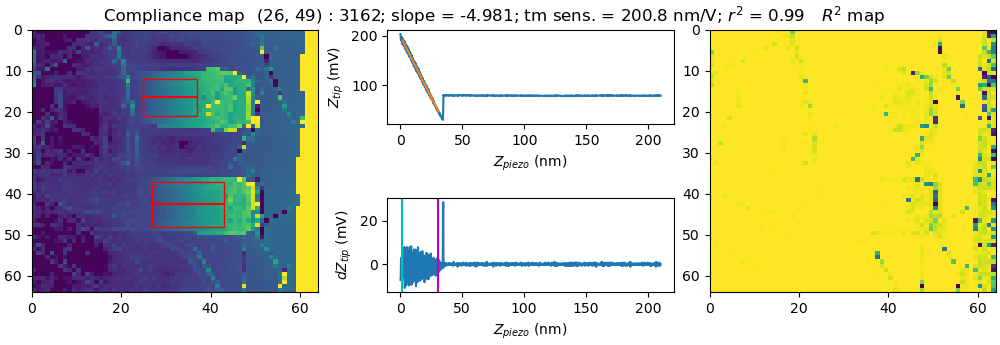
# Continued from above
cant_num    = 0 # Cantilever number
rows_to_avg = 3 # Number of rows to average around center line of cantilever

(E, offset, E_lin, offset_lin) = calc_modulus(fv, cant_num)

print("---- Cubic fit ----")
print(f"Young's modulus: {E/1e9:.2f} GPa")
print(f"Offset: {offset*1e6:.2f} µm")

print("---- Linearized fit ----")
print(f"Young's modulus: {E_lin/1e9:.2f} GPa")
print(f"Offset: {offset_lin*1e6:.2f} µm")
Output:
---- Cubic fit ----
Young's modulus: 145.97 GPa
Offset: 4.14 µm
---- Linearized fit ----
Young's modulus: 158.66 GPa
Offset: 4.04 µm
If you are having issues installing or using this software, or would like to report a bug, please create a new issue in this repository. Please provide as much information as possible, including a reproducible example (if applicable).
Feature requests and pull requests are welcome. If you would like to contribute, but do not know where to start, you may create a new issue. Please let us know your interests and how you would like to help.