In this lesson, we'll review all of the guidelines and specifications for the final project for Module 4.
- Understand all required aspects of the Final Project for Module 4
- Understand all required deliverables
- Understand what constitutes a successful project
Final module down -- you're absolutely crushing it! You've made it all the way through one of the toughest modules of this course. You must have an amazing brain in your head!

For this module's final project, you have the choice of four problems:
- Time Series Modeling
- Recommendation System
- Image Classification with Deep Learning
- Natural Language Processing
For each problem, we have provided a dataset. You may use a dataset of your own choosing with your instructor's approval.
Like Project #3, the focus here is on prediction. It will be up to you to determine how best to evaluate your model, but for any of these projects your goal is to build something that works.
When choosing a problem, consider:
- Portfolio Depth: One option is to choose the same type of problem you plan to tackle in Module 5 (capstone). This will allow you to practice the necessary skills in a group setting, before diving into your individual project. You will likely produce a capstone project that is more polished and sophisticated, but your portfolio will demonstrate less breadth.
- Portfolio Breadth: Another option is to choose a type of problem that interests you, but that you don't plan to use in your capstone project. Each of your individual projects will end up less polished and sophisticated, but you will end up with a portfolio that demonstrates a wider range of skills.
If you choose the Time Series option, you will be forecasting real estate prices of various zip codes using data from Zillow. However, this won't be as straightforward as just running a time-series analysis -- you're going to have to make some data-driven decisions and think critically along the way!
For this project, you will be acting as a consultant for a fictional real-estate investment firm. The firm has asked you what seems like a simple question:
What are the top 5 best zip codes for us to invest in?
This may seem like a simple question at first glance, but there's more than a little ambiguity here that you'll have to think through in order to provide a solid recommendation. Should your recommendation be focused on profit margins only? What about risk? What sort of time horizon are you predicting against? Your recommendation will need to detail your rationale and answer any sort of lingering questions like these in order to demonstrate how you define "best".
As mentioned previously, the data you'll be working with comes from the Zillow Research Page. However, there are many options on that page, and making sure you have exactly what you need can be a bit confusing. For simplicity's sake, we have already provided the dataset for you in this repo -- you will find it in the file time-series/zillow_data.csv.
The goal of this project is to have you complete a very common real-world task in regard to time series modeling. However, real world problems often come with a significant degree of ambiguity, which requires you to use your knowledge of statistics and data science to think critically about and answer. While the main task in this project is time series modeling, that isn't the overall goal -- it is important to understand that time series modeling is a tool in your toolbox, and the forecasts it provides you are what you'll use to answer important questions.
In short, to pass this project, demonstrating the quality and thoughtfulness of your overall recommendation is at least as important as successfully building a time series model!
For this project, you will be provided with a Jupyter notebook, time-series/starter_notebook.ipynb, containing some starter code. If you inspect the Zillow dataset file, you'll notice that the datetimes for each sale are the actual column names -- this is a format you probably haven't seen before. To ensure that you're not blocked by preprocessing, we've provided some helper functions to help simplify getting the data into the correct format. You're not required to use this notebook or keep it in its current format, but we strongly recommend you consider making use of the helper functions so you can spend your time working on the parts of the project that matter.
In addition to deciding which quantitative metric(s) you want to target (e.g. minimizing mean squared error), you need to start with a definition of "best investment". Consider additional metrics like risk vs. profitability, or ROI yield.
If you choose the Recommendation System option, you will be making movie recommendations based on the MovieLens dataset from the GroupLens research lab at the University of Minnesota. Unless you are planning to run your analysis on a paid cloud platform, we recommend that you use the "small" dataset containing 100,000 user ratings (and potentially, only a particular subset of that dataset).
Your task is to:
Build a model that provides top 5 movie recommendations to a user, based on their ratings of other movies.
The MovieLens dataset is a "classic" recommendation system dataset, that is used in numerous academic papers and machine learning proofs-of-concept. You will need to create the specific details about how the user will provide their ratings of other movies, in addition to formulating a more specific business problem within the general context of "recommending movies".
At minimum, your recommendation system must use collaborative filtering. If you have time, consider implementing a hybrid approach, e.g. using collaborative filtering as the primary mechanism, but using content-based filtering to address the cold start problem.
The MovieLens dataset has explicit ratings, so achieving some sort of evaluation of your model is simple enough. But you should give some thought to the question of metrics. Since the rankings are ordinal, we know we can treat this like a regression problem. But when it comes to regression metrics there are several choices: RMSE, MAE, etc. Here are some further ideas.
If you choose this option, you'll put everything you've learned together to build a deep neural network that trains on a large dataset for classification on a non-trivial task. In this case, using x-ray images of pediatric patients to identify whether or not they have pneumonia. The dataset comes from Kermany et al. on Mendeley, although there is also a version on Kaggle that may be easier to use.
Your task is to:
Build a model that can classify whether a given patient has pneumonia, given a chest x-ray image.
With Deep Learning, data is king -- the more of it, the better. However, the goal of this project isn't to build the best model possible -- it's to demonstrate your understanding by building a model that works. You should try to avoid datasets and model architectures that won't run in reasonable time on your own machine. For many problems, this means downsampling your dataset and only training on a portion of it. Once you're absolutely sure that you've found the best possible architecture and other hyperparameters for your model, then consider training your model on your entire dataset overnight (or, as larger portion of the dataset that will still run in a feasible amount of time).
At the end of the day, we want to see your thought process as you iterate and improve on a model. A project that achieves a lower level of accuracy but has clearly iterated on the model and the problem until it found the best possible approach is more impressive than a model with high accuracy that did no iteration. We're not just interested in seeing you finish a model -- we want to see that you understand it, and can use this knowledge to try and make it even better!
Evaluation is fairly straightforward for this project. But you'll still need to think about which metric to use and about how best to cross-validate your results.
If you choose this option, you'll build an NLP model to analyze Twitter sentiment about Apple and Google products. The dataset comes from CrowdFlower via data.world. Human raters rated the sentiment in over 9,000 Tweets as positive, negative, or neither.
Your task is to:
Build a model that can rate the sentiment of a Tweet based on its content.
There are many approaches to NLP problems - start with something simple and iterate from there. For example, you could start by limiting your analysis to positive and negative Tweets only, allowing you to build a binary classifier. Then you could add in the neutral Tweets to build out a multiclass classifier. You may also consider using some of the more advanced NLP methods in the Mod 4 Appendix.
Evaluating multiclass classifiers can be trickier than binary classifiers because there are multiple ways to mis-classify an observation, and some errors are more problematic than others. Use the business problem that your NLP project sets out to solve to inform your choice of evaluation metrics.
For online students, your completed project should contain the following four deliverables:
-
A Jupyter Notebook containing any code you've written for this project. This work will need to be pushed to a public GitHub repository dedicated for this project.
-
An organized README.md file in the GitHub repository that describes the contents of the repository. This file should be the source of information for navigating through the repository.
-
A Blog Post.
-
An "Executive Summary" PowerPoint Presentation that gives a brief overview of your problem/dataset, and each step of the data science process.
Note: On-campus students may have different deliverables, please speak with your instructor.
For this project, your Jupyter Notebook should meet the following specifications:
Organization/Code Cleanliness
- The notebook should be well organized, easy to follow, and code is commented where appropriate.
- Level Up: The notebook contains well-formatted, professional looking markdown cells explaining any substantial code. All functions have docstrings that act as professional-quality documentation.
- The notebook is written to technical audiences with a way to both understand your approach and reproduce your results. The target audience for this deliverable is other data scientists looking to validate your findings.
Process, Methodology, and Findings
- Your notebook should contain a clear record of your process and methodology for exploring and preprocessing your data, building and tuning a model, and interpreting your results.
- We recommend you use the OSEMN process to help organize your thoughts and stay on track.
As usual, the best way to present findings is often visually, and the tips and reminders below should apply to any of these projects.
But please pay special attention to this section if choosing Project #1 because time series analysis is an area of data science that lends itself well to intuitive data visualizations. Whereas we may not be able to visualize the best choice in a classification or clustering problem with a high-dimensional dataset, that isn't an issue with time series data. As such, any findings worth mentioning in this problem are probably also worth visualizing.
Your notebook should make use of data visualizations as appropriate to make your findings obvious to any readers. And, when it comes to moving images out of notebooks, make an effort to export them rather than taking screen shots. Note e.g. matplotlib.pyplot.savefig(), an in-built exportation tool. See here for more sophisticated possibilities.
Remember that if a visualization is worth creating, then it's also worth taking the extra few minutes to make sure that it is easily understandable and well-formatted. When creating visualizations, make sure that they have:
- A title
- Clearly labeled X and Y axes, with appropriate scale for each
- A legend, when necessary
- No overlapping text that makes it hard to read
- An intelligent use of color -- multiple lines should have different colors and/or symbols to make them easily differentiable to the eye
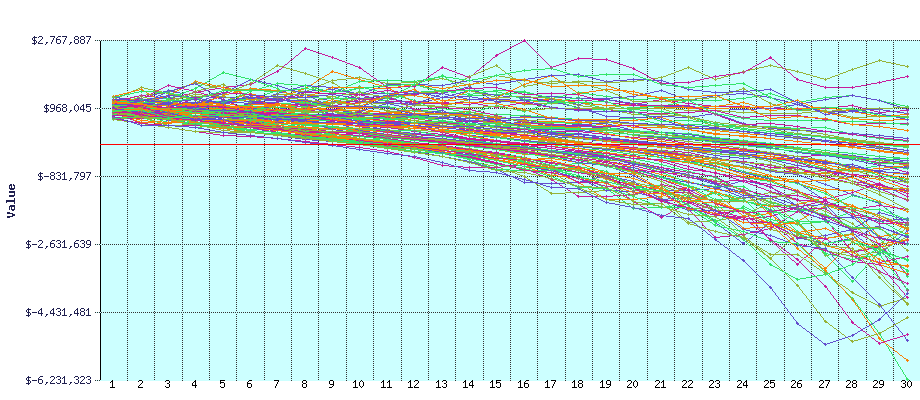
- An appropriate amount of information -- avoid creating graphs that are "too busy". For instance, don't create a line graph with 25 different lines on it.

Refer back to the Blogging Guidelines for the technical requirements and blog ideas.
These steps are informed by Smart Vision's1 description of the CRISP-DM process.
Start by reading this document, and making sure that you understand the kinds of questions being asked. In order to narrow your focus, you will likely want to make some design choices about your specific audience, rather than attempting to address all potentially-relevant concerns. Think about what kinds of predictions you want to be able to make, and about which kinds of wrong predictions are most concerning.
Three things to be sure you establish during this phase are:
- Objectives: what questions are you trying to answer, and for whom?
- Project plan: you may want to establish more formal project management practices, such as daily stand-ups or using a Trello board, to plan the time you have remaining. Regardless you should determine the division of labor, communication expectations, and timeline.
- Success criteria: what does a successful project look like? How will you know when you have achieved it? At this point you should be able to establish at least one quantitative success metric, before you even decide on which model(s) you are going to try.
Write a script to download the data (or instructions for future users on how to manually download it), and explore it. Do you understand what the columns mean? If the dataset has more than one table, how do they relate to each other? How will you select the subset of relevant data? What kind of data cleaning is required?
It may be useful to generate visualizations of the data during this phase.
Through SQL and Pandas, perform any necessary data cleaning and develop a query that pulls in all relevant data for modeling, including any merging of tables. Be sure to document any data that you choose to drop or otherwise exclude. This is also the phase to consider any feature scaling or one-hot encoding required to feed the data into your particular model.
Similar to the Mod 3 project, the focus is on prediction. Good prediction is a matter of the model generalizing well. Steps we can take to assure good generalization include: testing the model on unseen data, cross-validation, and regularization. What sort of model should you build?
Here you will also likely encounter problems with computational capacity. Figure out how to use smaller samples of your data in order to tweak hyperparameters. Investigate cloud tools with hardware acceleration (e.g. Google Colab is a free one) in order to run your analysis with larger sets of data and more versions of the model.
Recall that there are many different metrics we might use for evaluating a classification model. Accuracy is intuitive, but can be misleading, especially if you have class imbalances in your target. Perhaps, depending on you're defining things, it is more important to minimize false positives, or false negatives. It might therefore be more appropriate to focus on precision or recall. You might also calculate the AUC-ROC to measure your model's discrimination.
In this case, your "deployment" comes in the form of the deliverables listed above. Make sure you can answer the following questions about your process:
- "How did you pick the question(s) that you did?"
- "Why are these questions important from a business perspective?"
- "How did you decide on the data cleaning options you performed?"
- "Why did you choose a given method or library?"
- "Why did you select these visualizations and what did you learn from each of them?"
- "Why did you pick those features as predictors?"
- "How would you interpret the results?"
- "How confident are you in the predictive quality of the results?"
- "What are some of the things that could cause the results to be wrong?"
Online students can find a PDF of the grading rubric for the project here. Note: On-campus students may have different requirements, please speak with your instructor.
- "What is the CRISP-DM Methodology?" Smart Vision Europe. Available at: https://www.sv-europe.com/crisp-dm-methodology/