Using data from Armada Rotta's site, I've put together a quick tracker to visualize equipment losses since the October 7th invasion of Israel by Hamas. This is only equipment that is independently verified by Armada Rotta:
Data is drawn from this public google sheet which is updated based on the last update for each day. As such it is a lagging indicator, dependent not just on when equipment is lost, but when it is discovered and documented.
Data is pulled daily from Armada Rotta's site using Daniel Scarnecchia's scraper tool, and then pushed to the public google sheet, where synthetic calculations are performed for equipment categories (to preserve transparency).
Points (blue = Israel, green = Hamas) represent cumulative losses for each day, bars represent daily losses. The line represents a general additive model smooth on cumulative losses to date; the shaded grey band represents the 95% confidence interval based on extant variation (e.g. point scatter). A wider grey band means more uncertainty, a narrower grey band means less uncertainty.
Please keep in mind that this is empirical, not interpretive, analysis. A concern raised about the available data is that it undercounts Ukrainian losses. This is possible not just because of bias (note that pro-Russian sources are monitored as well) but because areas under Russian control are less likely to have photo documentation. Fog of war is very real. There is no attempt here to use a modifier to adjust numbers - analysis is strictly empirical. Any bias in the original data will be reflected in the following analyses.
Lastly, if you would like to make edits to descriptions of these data feel free to create a pull request or a new issue.
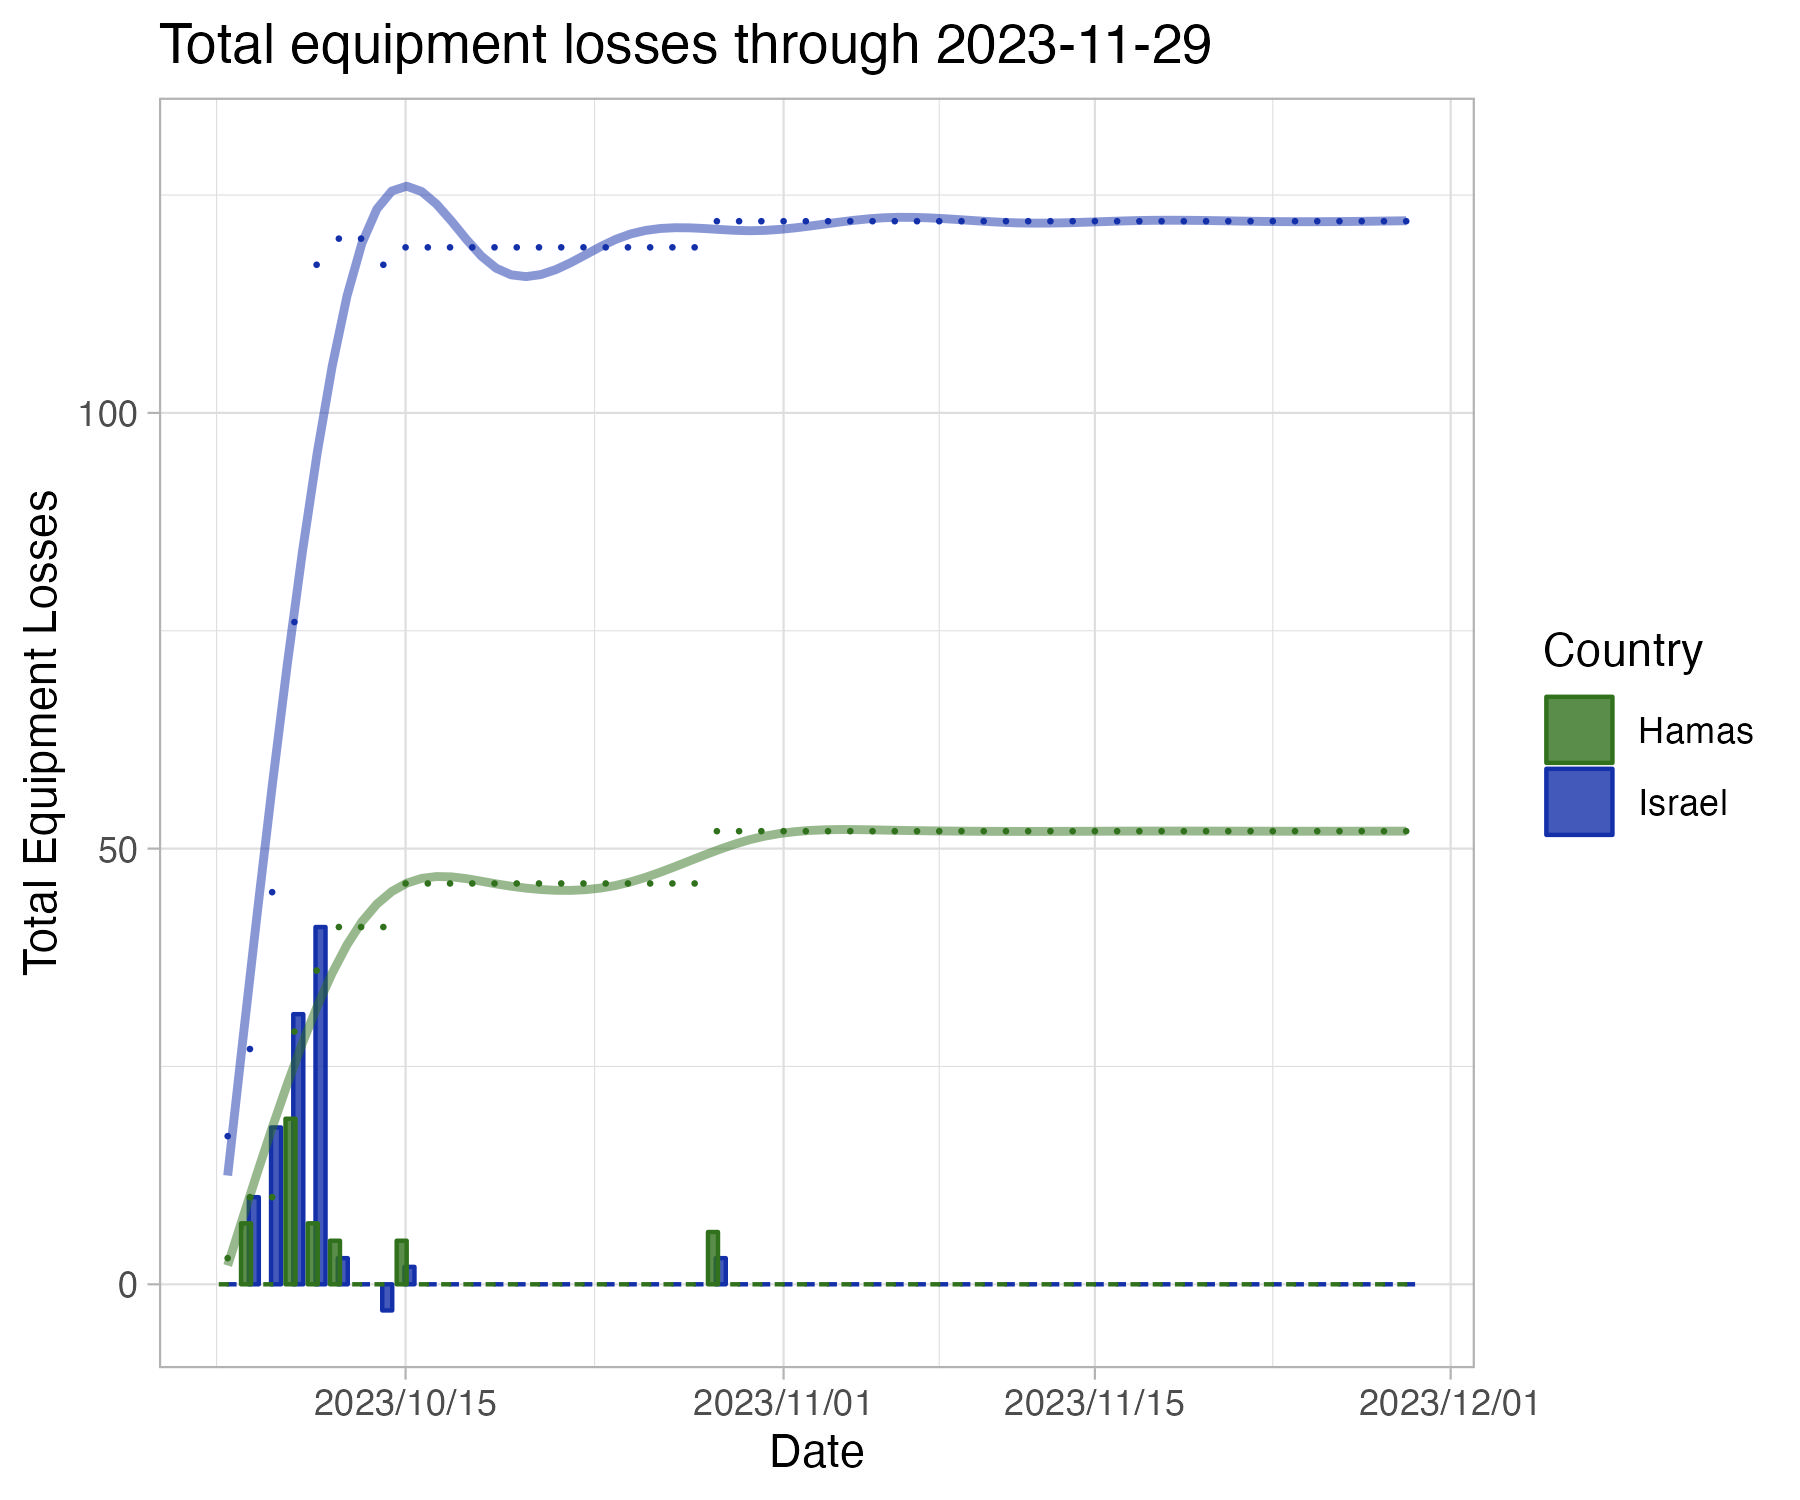 At the outset of the war, Hamas managed to inflict dispropritionate losses on Israel.
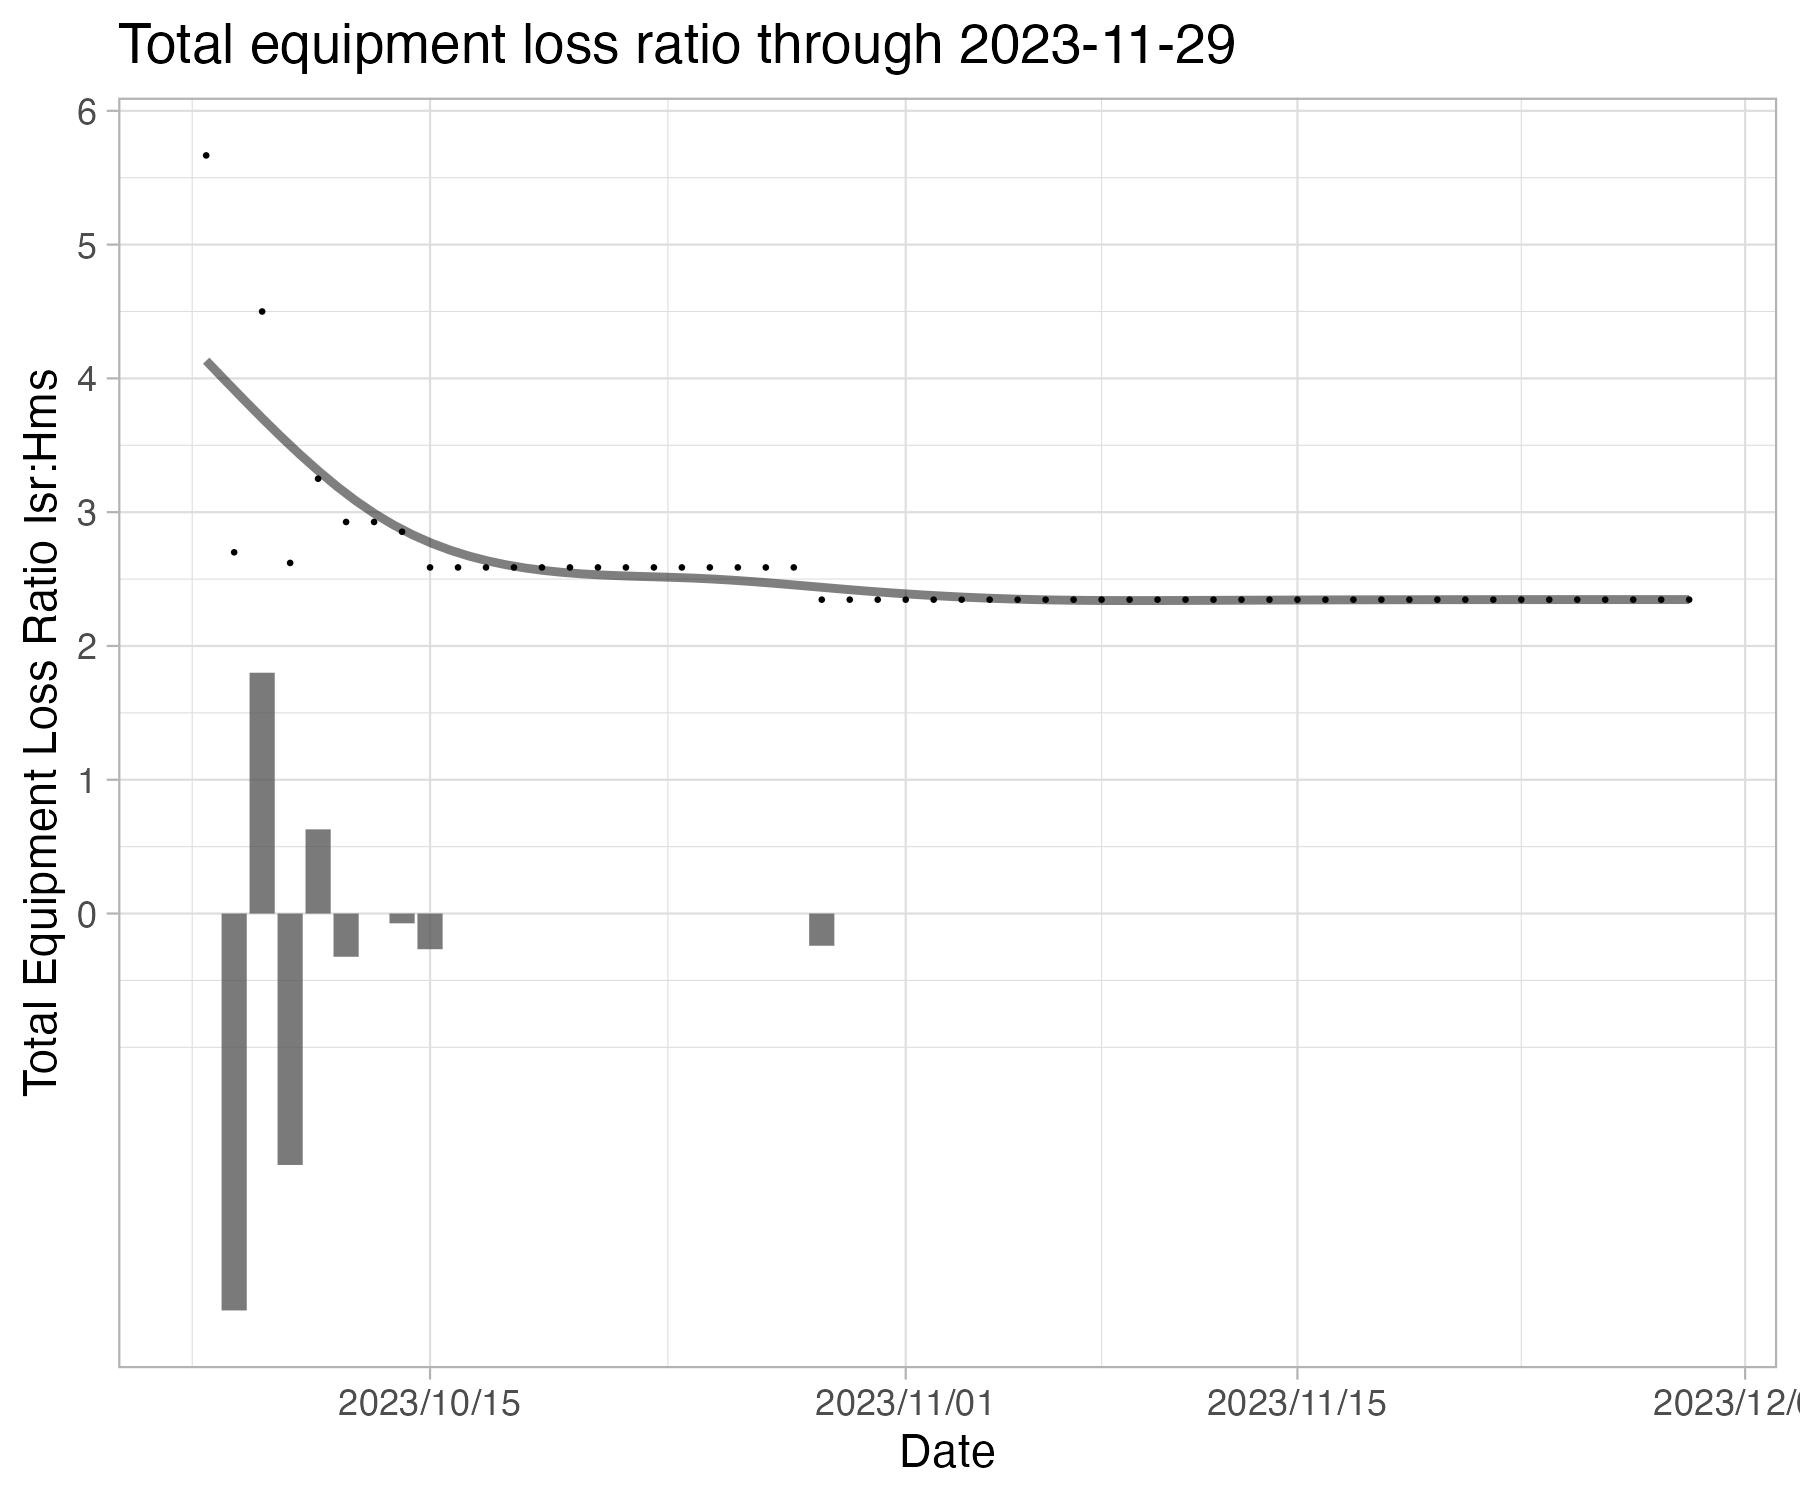 The equipment loss ratio will be very dynamic at the start of the conflict.
Map data is provided using a Google maps base layer. Fire data comes from NASA FIRMS VIIRS satellite.
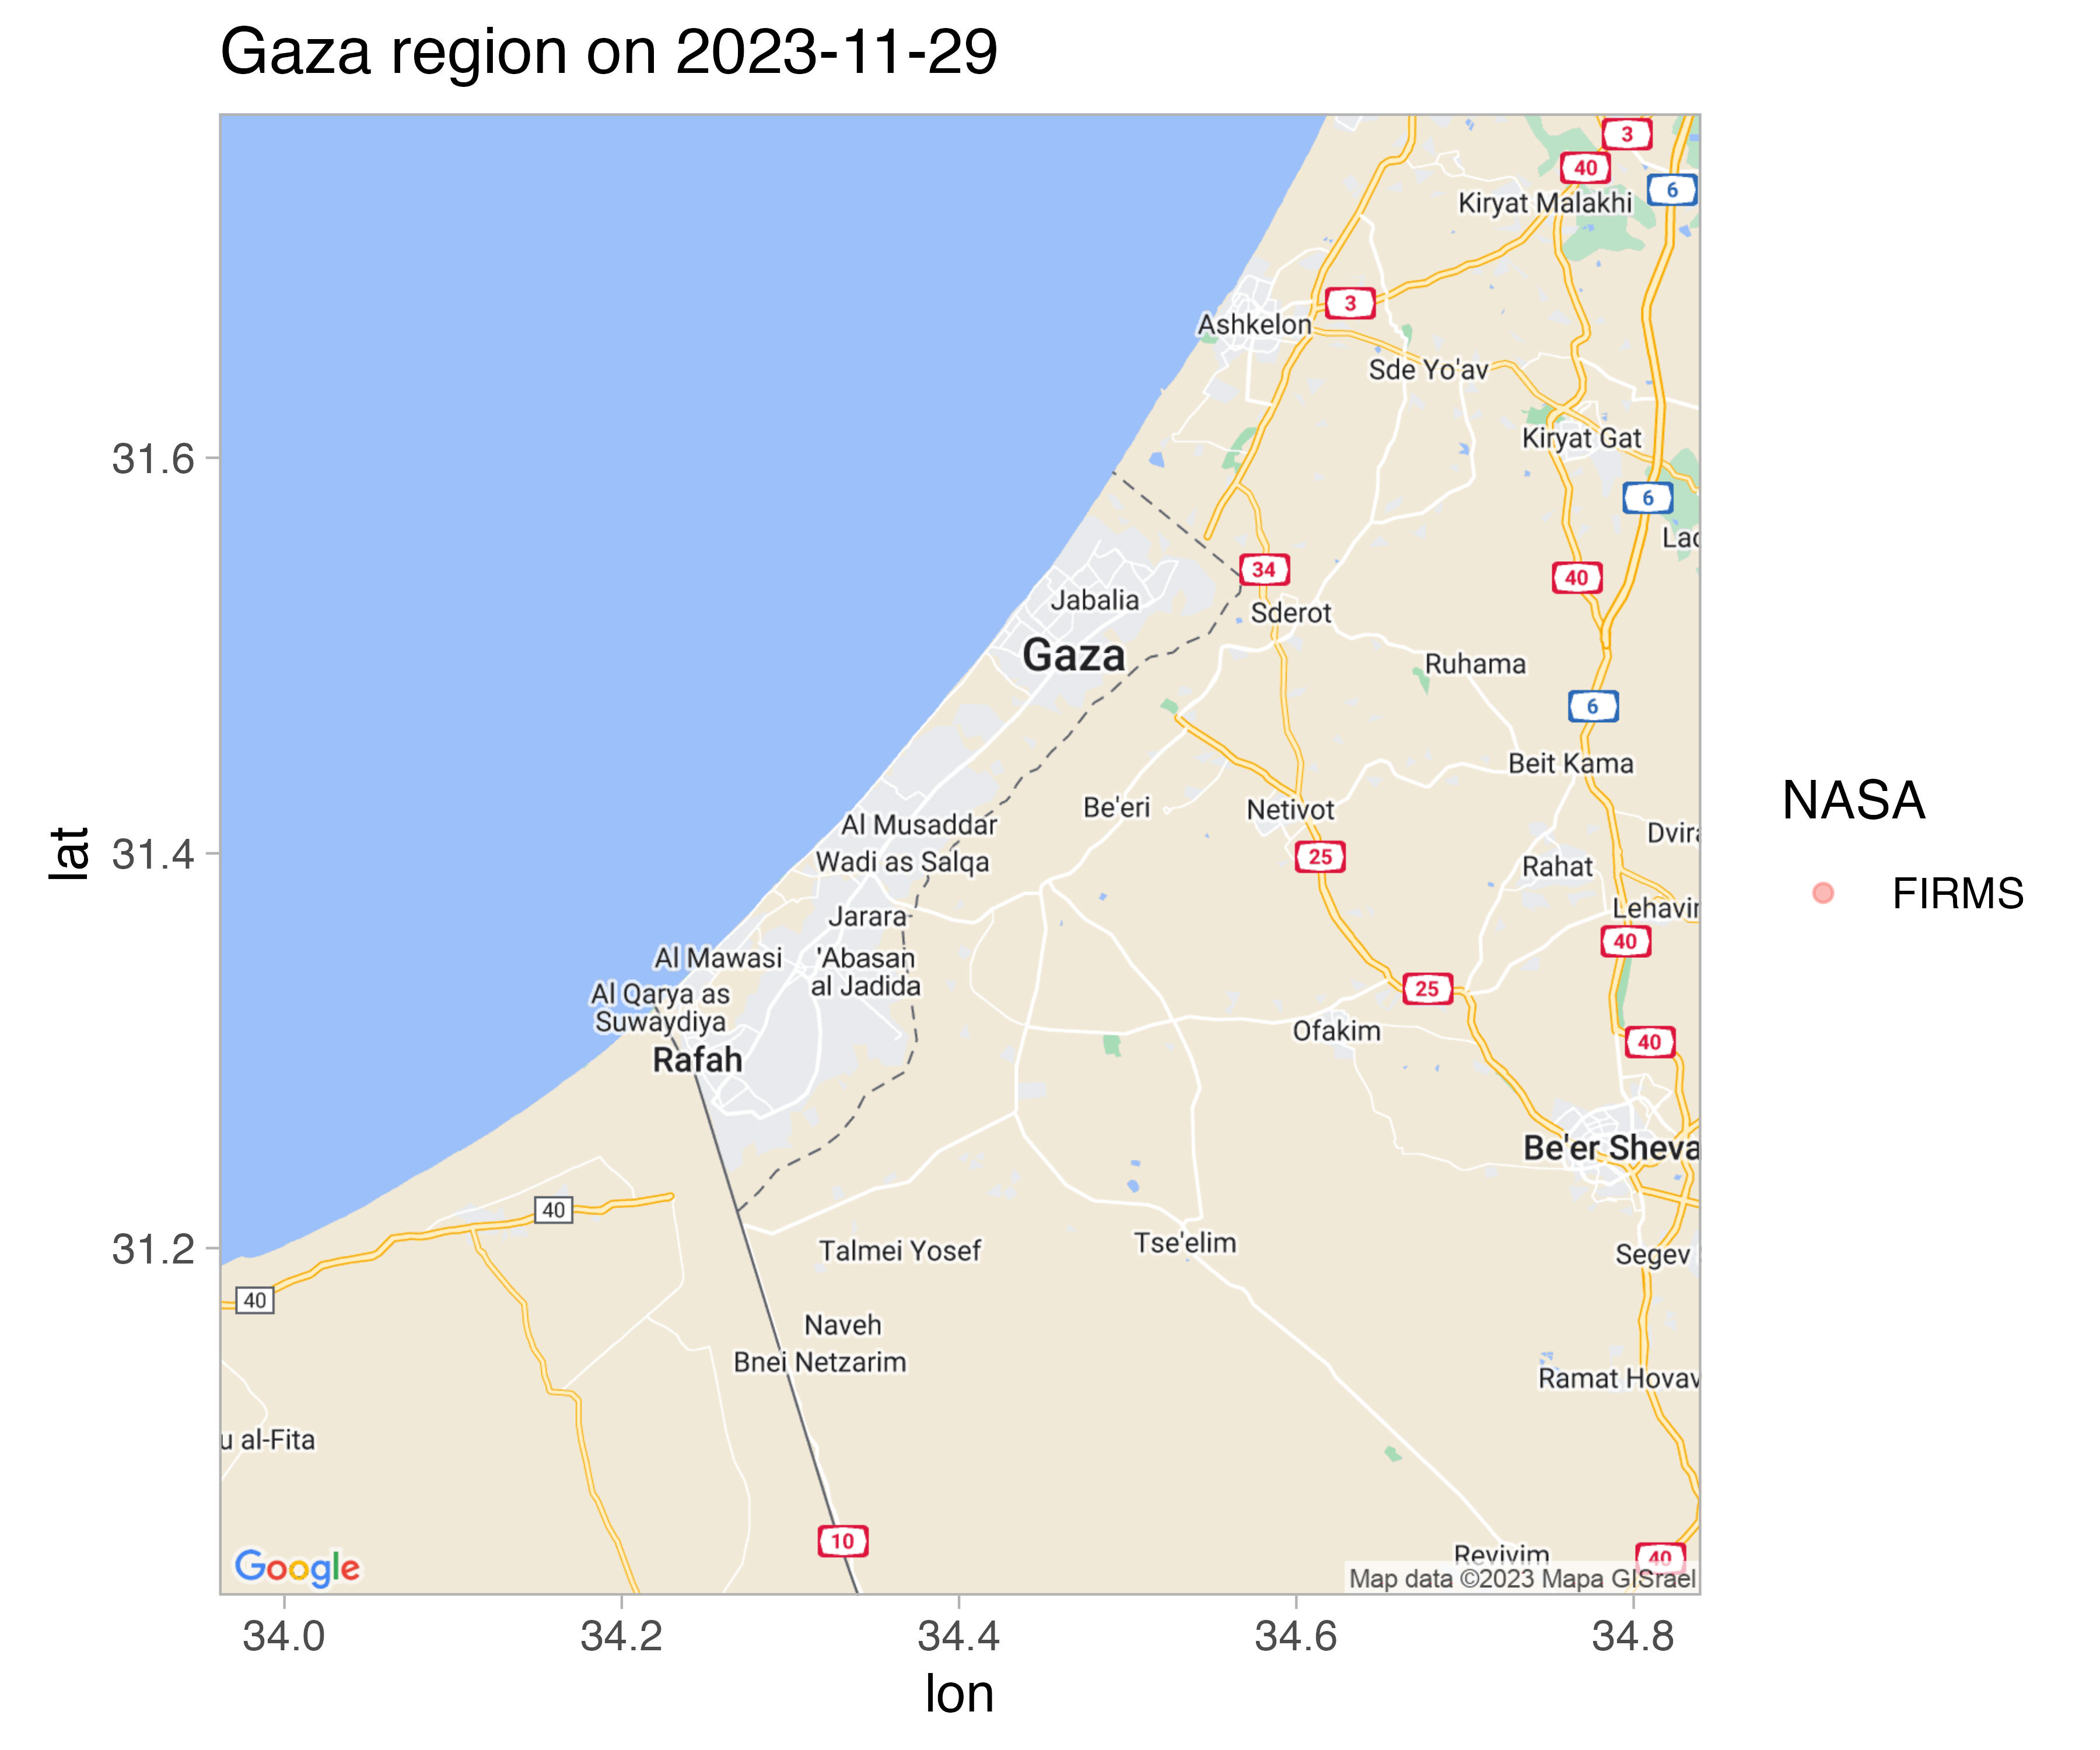 The attack by Hamas was primarily located along the outskirts of Gaza
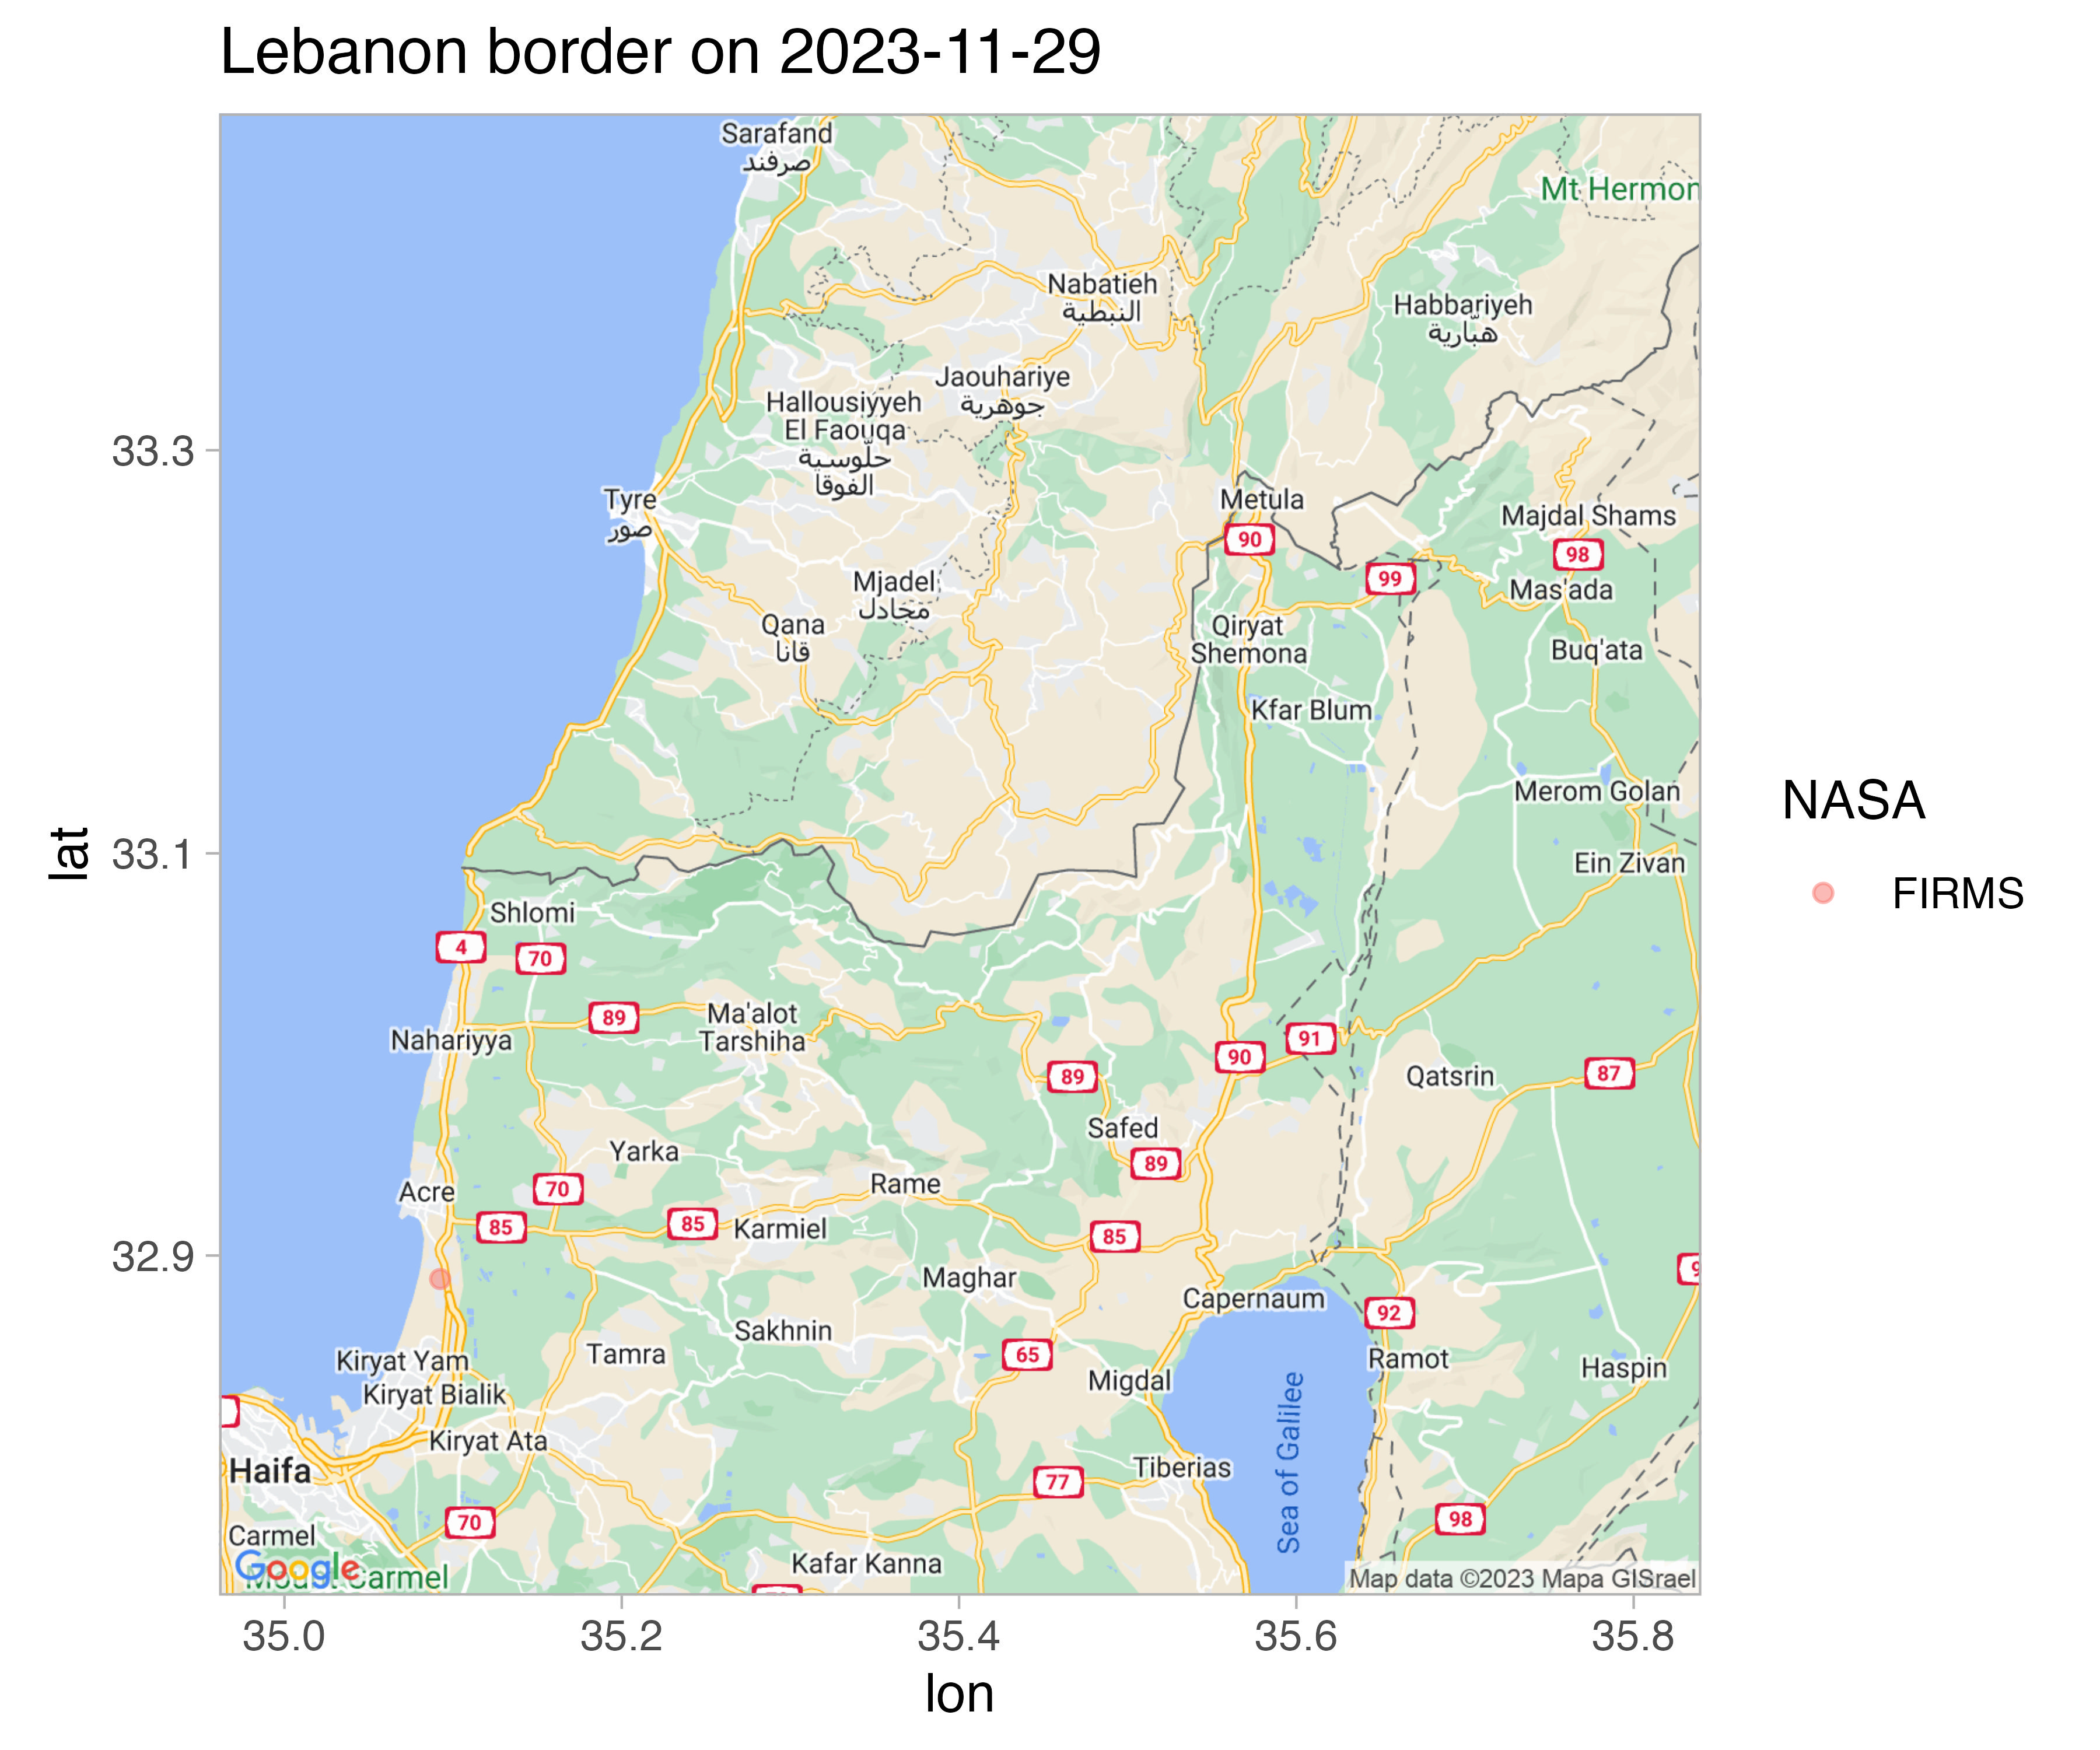 Lebanon has seen some limited rocket fire between Hezbollah and Israel.
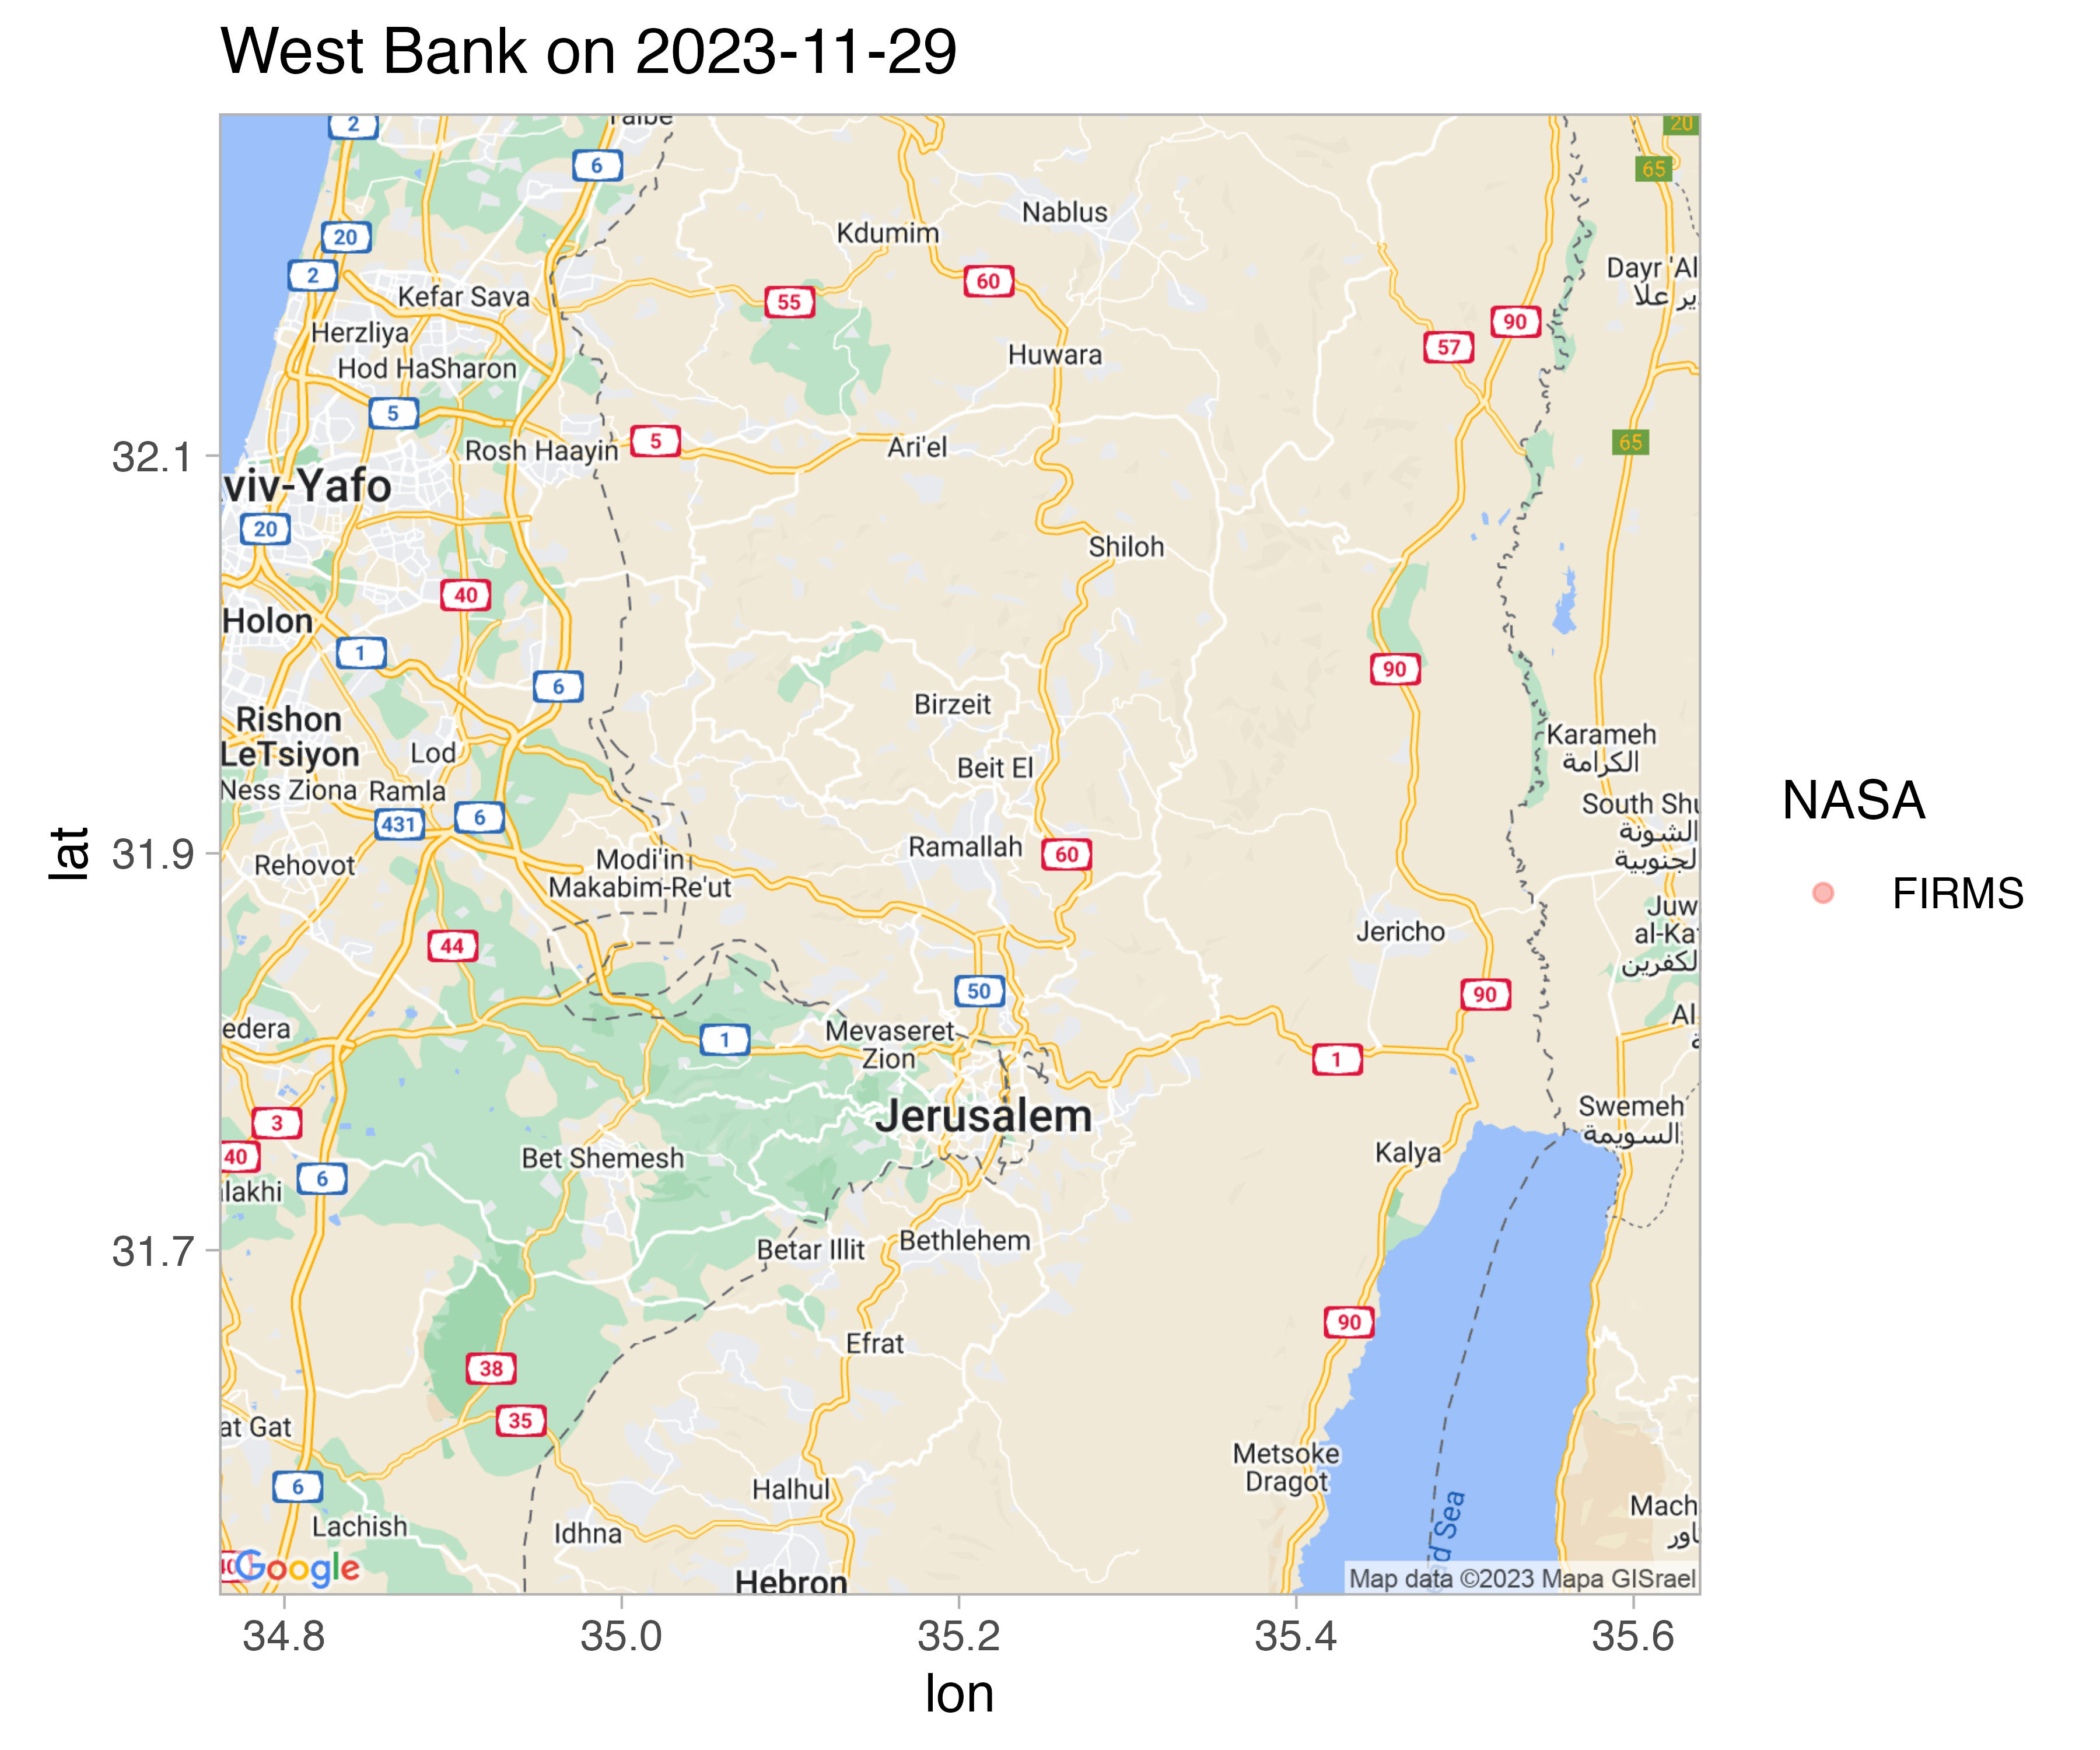 Fighting has not yet been widespread in the West Bank.
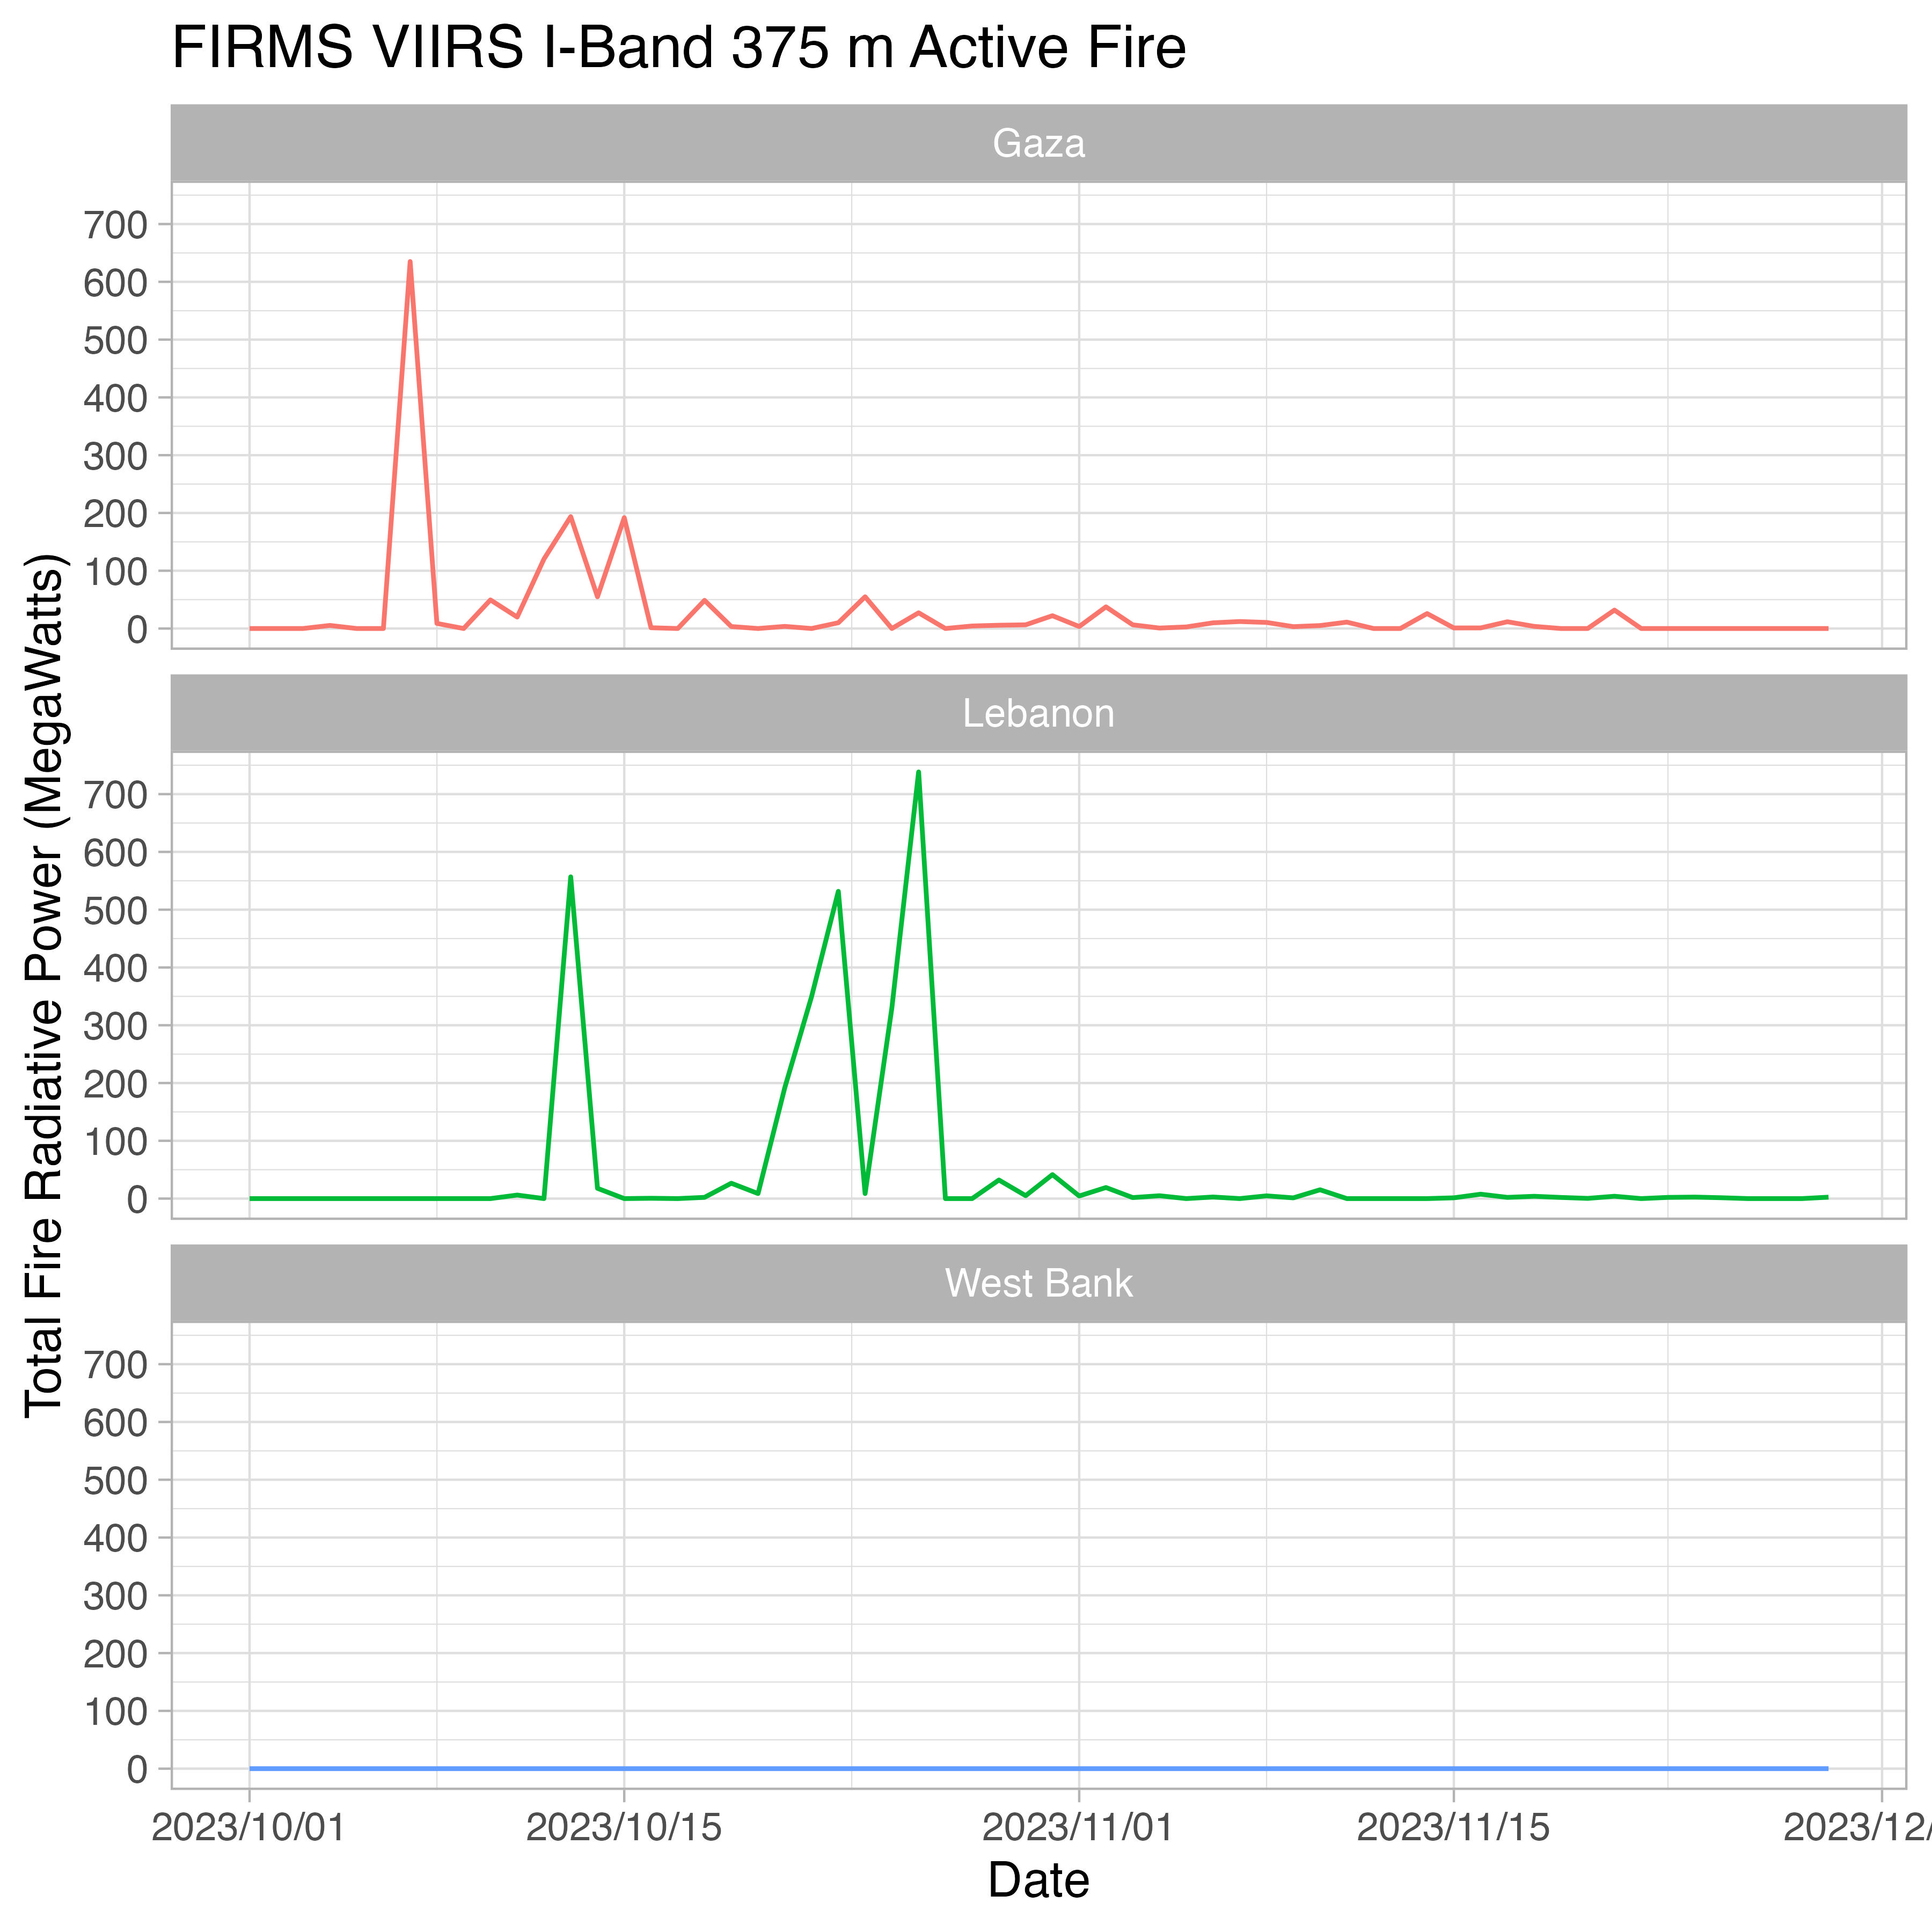
An extended discussion of how to evaluate these analyses are here. In general, the fire radiative power plots (FRP) are a useful guide to activity. To date only a sizable FRP has been detected on the first day of the conflict near Gaza.