Automated power ranker built for a 12-team ESPN Fantasy Football league using Excel and VBA.
Table of contents:
Weekly summary table with each team's latest stats. Team pictures and trophies/skulls dropped in with VBA.

Rankings for each team's players. Includes positional rankings and the best/worst corps for each position across the league.
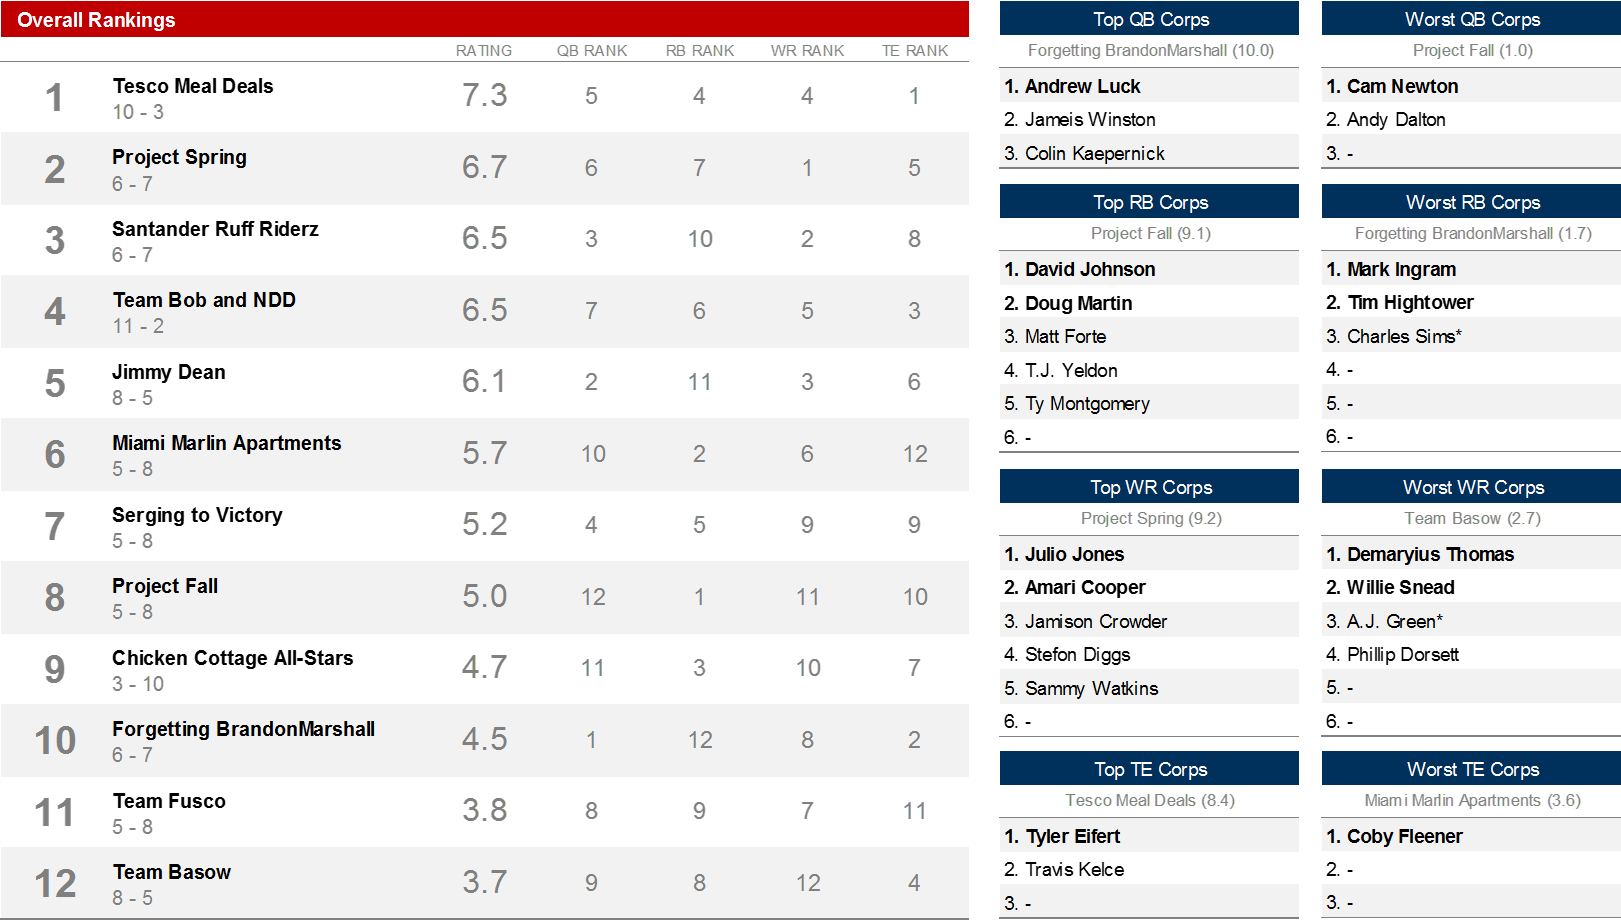
Details and ranks the positional corps for each team. Player ordering and ratings calculations use weekly trade values from CBS Sports.

Graphically displays each team's scores across the season. Green circles are wins and red circles are losses. Larger circles are for more recent weeks; sizing updates done using VBA.

To calculate a team's overall power ranking score, the ranker uses a weighted average of three metrics: roster strength, season performance, and recent performance. The relative weights of these metrics adjusts throughout the season -- as the season goes on, the impact of season-long win/loss strongly increases and the impact of roster strength decreases.
A team's roster strength is calculated as follows:
1. Rank each team's QB, RB, WR, and TE corps using CBS' trade value charts (i.e., determine each team's RB1, RB2, etc.)
- Manually updated trade value tables can capture factors (e.g., injury status) that more quantitative metrics (e.g., average ppg) can't pick up as easily
- Trade values are designed to be roughly additive, reflecting the premiums placed on top players
- From the 2016 season's week 13 trade values, the top three running backs (David Johnson, Le'Veon Bell, and Ezekiel Elliott) were valued in the 45-50 point range
- The #6 and #7 RBs (LeSean McCoy and Jay Ajayi) were valued at 31.5 and 25 points respectively
- Generic waiver wire ("WW") replacements are valued at 4 points
- The two RB corps below are roughly equal by the eyeball test and have approximately the same total trade value (~60 points)
- David Johnson + 3 WW RBs
- LeSean McCoy + Jay Ajayi + 1 WW RB
- D/ST players are ignored due to the high variability in week-to-week performance (D/ST scoring is highly dependent on the strength of that week's opposing offence)
- Kickers are also excluded (with apologies to Gostkowski owners)
- Our league starts 1 QB, 2 RB, 2 WR, 1 TE, 1 FLEX (RB/WR/TE), 1 D/ST, and 1 K and has five bench spots
- Starters are given 100% credit for their trade value scores
- Since our league doesn't use a "Superflex" position (where a QB can be also played in the flex spot), the value of the second-best QB on a team is much lower than that of the first
- RB and WR depth is highly important due to the ability to play a third RB/WR in the flex spot and due to injury considerations
- While TEs can also be flexed, only the very top TEs typically offer consistent scoring -- tight ends outside the top ten are only marginally better than waiver wire TEs
- As a result, holding extra TEs (even top five players) is generally less favorable than holding extra RBs and WRs
- Taking the above into consideration, the trade value of each player is multiplied by the below factor:
| # | QB | RB | WR | TE |
|---|---|---|---|---|
| 1 | 100% | 100% | 100% | 100% |
| 2 | 25% | 100% | 100% | 40% |
| 3 | 15% | 80% | 80% | 20% |
| 4 | 5% | 50% | 50% | - |
| 5 | - | 40% | 40% | - |
| 6 | - | 30% | 30% | - |
| 7 | - | 20% | 20% | - |
| 8 | - | 10% | 10% | - |
- The values for each team's QB, RB, WR, and TE corps are individually added and then scaled to a 1-10 point overall rating
- Positional ratings are individually calculated since the total strength of a roster is determined by summing the point outputs of each individual position (i.e., QB points + RB points + ...)
- The mean score for each positional corps across the league is set to correspond to a positional rating of 5.5
- The positional corps strength required for a 10.0 rating is manually set and is roughly equal to the strength of the top positional corps across the league mid-way through the season
- Necessary to manually calibrate the 10.0 ratings since the scaling for CBS' trade values fluctuates week to week and season to season
- Ratings from 1 to 10 are calculated on a linear scale based on the 5.5 and 10.0 rating scores established above; a hard floor and ceiling are set at 1.0 and 10.0 respectively
- The relative weighting of each position is calculated based on the number of players in that position that are owned across the league
- For QBs and TEs, the weight is calculated as the number of owned QBs / TEs divided by the total number of QBs, RBs, WRs, and TEs owned across the league
- The weighting for RBs and WRs are set equal given the interchangeability of the RB and WR position and is calculated as the sum of owned RBs and WRs divided by two divided by the total owned QBs/RBs/WRs/TEs in the league
- In our league, after the regular season we had 22 QBs, 50 RBs, 53 WRs, and 18 TEs owned (143 total), giving weights of 15.4%, 36.0%, 36.0%, and 12.6% respectively
- Using this methodology, teams start the season clustered around a 5.5 rating and separate out as the season goes on
This metric takes into account the average weekly points scored by a team and that team's win-loss record across the season.
- Each team's points per week ("PPW") is given a rating linearly scaled based on the min (1.0) and max (10.0) PPW scored across the league
- Wins are scaled 1-10 as a fraction of total possible wins (i.e., the number of weeks elapsed in the season)
- The relative weighting between PPW and wins is based on the number of weeks elapsed
- Starts at 25% wins / 75% PPW in week 1
- Win rating weight increases by 4% each week, ending at 77% wins / 23% PPW after a 13-week regular season
The recent performance metric is similar in nature to season performance but only includes results from the past three weeks. This metric is included to help ensure that wins/losses and high/low point performances are directly reflected in the following week's rankings. Recent performance ratings aren't scaled or capped to allow for exceptional (-ly good or bad) performances to be visible in the overall rankings.
- Includes results from the past three weeks weighted at 70%, 20%, and 10% respectively
- For each week:
- A Points For ("PF") score is calculated as (PF - Mean Points Scored Per Week League-Wide) / 5; can be positive or negative
- A win is given a 10 point score and a loss gets a 1 point score
- An extra half point is given to the highest scorer each week and a half point is taken away from the lowest scorer
- Weighting is 65% PF / 35% wins +/- half points
This model was built with the goal of simulating "human" power rankings (e.g., ESPN college football) as closely as possible. After a bit of trial and error, the below weightings gave the best results week to week:
- Season Performance: 25% + (WeekNum * 4%)
- Recent Performance: 20% - (WeekNum * 1%)
- Roster Strength: 100% - SeasonWeight - RecentWeight
The power rankings are run through a single Excel file with some help from VBA for pictures/graphs. The Excel file for week 13 of last year's season is included in this repository. Exploring the model sheet by sheet:
Main output sheet which includes overall rank, rank trend, last game, metric ranks (roster, season, recent), playoff odds, and number of times each team was the high ("JR") and low ("SV") scorer each week.
Images (team icon, # of JRs, # of SVs) are updated by pressing refresh button which executes a VBA code snippet to reload images from the drive and position accordingly. The rest of the output table is linked to other sheets with INDEX/MATCH functions and formatted to update without manual input. The "Trending" arrows are cell formatted to show an up arrow/down arrow/dashes for a positive/negative/zero value and are conditionally formatted to be green/red/grey accordingly.
Serves as the final calculation sheet for the output sheet.
- Consolidates roster, season, and recent performance ratings and performs final weighting
- Calculates overall and individual metric rankings
- Links to "Scores" sheet to extract score and result from last game
- Links to "Playoffs" sheet for calculated top 2 (first round bye) and top 6 (playoffs cutoff) seeding chances
- Includes copy-pasted overall rankings from the previous week's file to determine week-to-week ranking trend
Performs final calculations for roster strength metric and provides various roster ranking outputs.
Links to "Schedule" sheet which contains raw ESPN output for all previous scores and all future scheduled matchups. Summary section of sheet contains summary performance statistics and calculations for recent performance metric as described above. The score calculations section parses the ESPN page as follows:
- There are 13 columns corresponding to each week of the fantasy season
- Each team gets a row for each specific metric (team score, opponent name, etc.) for that week
- Reference: Calculates references to each week's results on the "Schedule" sheet and provides text strings for later INDIRECT function usage
- "Row" searches for the starting row for each week's results (e.g., row 107 on the "Schedule" sheet is the "WEEK 1" header)
- Left Team / Right Team / Score Col provides the three text references (e.g.,
Schedule!A109:A114) which contain the away team, home team, and score for each week's games
- Left (0) / Right (1): Determines whether a team was considered the away team (in column A of the "Schedule" sheet = "0") or home team (column D = "1") of the results for that week's game
- Game Scores: Pulls the full game score for each team's weekly matchup (e.g., "XXX.X - YYY.Y")
- Team Score: Uses the left/right designation to determine which half of the game score ("XXX.X" or "YYY.Y") represents the given team's score
- JR / SV: Calculates the high ("JR") and low ("SV") scorer across the league for each week
- The source of the "JR" and "SV" names is an
inside jokeexercise left to the reader
- The source of the "JR" and "SV" names is an
- Opponent: Uses the other half of the left/right designation to determine the opponent's name for the week
- Opponent (clean): Searches for the left paren to remove the win-loss record at the end of the opposing team's name (e.g., "Tesco Meal Deals (10-3)" -> "Tesco Meal Deals")
- Opponent Score: Uses the other half of the left/right designation to determine the opponent's score for the week
- Win / Loss: Determines whether a team won or lost its game that week based on its score and its opponent's score
- Rank: Ranks each team's score across the league for that week
- Win Streak / Loss Streak / Streak: Calculates the current win or loss streak for each team for each week
This sheet primarily builds the scoring visualization found above. The graph consists of three parts which are separately formatted/created using VBA.
- A light grey min-max line connecting the bubbles for the lowest and highest scores
- A "wins" series for each week showing green bubbles representing winning scores for that week
- A corresponding "losses" series with red bubbles
The scores for more recent weeks correspond to larger bubbles. The min and max bubble sizes can be manually adjusted, and the sizing for intermediate weeks linearly scales between the two.
The sheet first pulls in the weekly scores and W/L status for each team from the "Scores" sheet. A wins array is created, only copying down winning scores and leaving losing scores blank; a corresponding array is created for losses. Each column (e.g., week 3 wins, week 7 losses) represents a specfic series on the graph with the same size and color of bubbles. Each team's min and max weekly score is also found and put into an array. VBA code is then run to size and color each graph series accordingly and draw min-max lines.
Finds and outputs the 15 highest and lowest overall weekly scores across the season using array multiplication searches.
- We have a 2D scores array with weeks across the top and teams down the side
- Goal is to identify the team/week (i.e., row and column) associated with the 15 largest and smallest values in the scores array
The steps below are to find the 15 highest scores:
- Create a separate array (equally sized to the scores array) ranking each score in the scores array in descending order; call it RankArray
- Perform the following row identifier search for each rank 1 through 15:
=SUMPRODUCT((RankArray = Rank) * ROW(RankArray)) - ROW(Header)- Where:
RankArrayis the 2D array of ranks described aboveRankis the desired ranking to be found (1 through 15)Headeris an achored reference to the top left cell of the table (in the same row/column as the weeks/teams)
RankArray = Rankreturns an array of FALSE values with a single TRUE where the desiredRankis foundROW(RankArray)returns an array where each entry represents the corresponding cell's row number- The (cell by cell) multiplication of the above arrays will return an array of zeroes with a single (non-zero) row number where the desired
Rankwas found, and usingSUMPRODUCTwill sum the array to return the row number- A double unary (
--) in front of the boolean RankArray is unnecessary since Excel understands to convert a boolean array to ones and zeroes once it encounters the multiplication sign - Equivalent to an array functioned SUM formula but allows a user to be less careful about using Ctrl + Shift + Enter
- A double unary (
- Subtract the row number of the top left header cell (one cell above and to the left of
RankArray) to find the numerical row offset
- Where:
- Run the same search to find the corresponding columns (substituting
COLUMNfunctions for the twoROWfunctions) - Starting at the header cell, use the
OFFSETfunction:- On the row values found above to find which team earned the #1, #2, etc. scores
- On the column values found above to find which week the #1, #2, etc. scores were earned
The process to find the 15 lowest overall scores involves the exact same steps with a RankArray where scores are ranked in ascending order.
Runs the roster strength algorithm on each team's roster. Team rosters are pulled from their respective sheets using INDIRECT functions.
Simulates the rest of the season's games to develop percentage odds for each team's playoff chances. A deep dive on the methodology behind these calculations would require a lot more coffee for me to write is beyond the scope of this document.
- 1,000 rows correspond to 1,000 independent simulations of the remainder of the season
- Each team's chance of winning a game is determined by its roster strength compared to its opponent's roster strength
- An example of the full W/L function for each game is:
=IF(ISNUMBER(I$19), I$19, IF(H$12<I$18, IF(Refresh=1,IF(RAND()<G24/(G24+H24),1,0),I24), 1-INDEX(24:24,1,MATCH(I$17,$11:$11,0)+(F$16*5-2))))
- An example of the full W/L function for each game is:
- After each simulated game, each team's roster strength is changed by a small random amount to simulate potential week-to-week roster strength changes (e.g., injuries, trades, waiver pickups)
- After running all remaining games, each team's final playoff seeding is calculated
- Final projected points per week is calculated using current PPW, roster strength, and some random variance
These three sheets provide the inputs that drive the model and are updated each week.
- Schedule: shows each week's matchups for the full season and the game results for past weeks
- CBS: weekly trade value chart put together by Dave Richards at CBS
- ESPN: consolidated roster page from ESPN
The "Schedule" and "ESPN" sheets are directly refreshed through Excel's external data functionality. Since each week's CBS trade values are published as a new web page, the first three columns of the "CBS" sheet are manually copy pasted in from the latest table. The rest of the sheet parses in the information from the pasted columns.
Each team's roster is parsed in on its own sheet for simplicity. The OFFSET and INDIRECT functions are used extensively to pull in each team's players. Sample formulas are provided from the sheet for team #1.
- SLOT: represents the row number of the word "SLOT" which is the heading for the first column of each team's roster on the "ESPN" sheet
- Since rosters are presented in three columns, teams 1-3 look for the 1st row in "ESPN" containing the word SLOT, teams 4-6 look for the 2nd row, and so on
- This is done with an array function using
SMALLto find the desired k-th smallest element andINTto round down the division {=SMALL(IF(ESPN!A:A=C5,ROW(ESPN!A:A)),INT((D3-1)/3+1))}
- Team Name Locoation: creates a text reference to the cell containing that team's name on the "ESPN" sheet
- Uses the SLOT location to determine the appropriate row and mod-3 math to determine the column
="ESPN!"&ADDRESS(D5-1,MOD($D$3-1,3)*3+1)
Once a cell reference to a specific roster has been established, one nuance that prevents us from using a simple increasing offset is potential blank roster rows. This happens when a league member hasn't fully filled in their starting lineup and has extra players on the bench. As a result, the offset code to pick up each player's name needs to find the first 14 non-blank rows in the roster rather than just the first 14 rows (14 being our league's roster size).
The function used for player 1 on team 1 is:
{=INDEX(OFFSET(INDIRECT($D$4),2,1,30), SMALL(IF(ISBLANK(OFFSET(INDIRECT($D$4),2,1,30)),"", ROW(OFFSET(INDIRECT($D$4),2,1,30))),B9) - ROW(INDIRECT($D$4))-1)}
- The repeated code snippet of
OFFSET(INDIRECT($D$4),2,1,30)represents an array that:- Offsets from the team name location at
$D$4by two rows and one column to reference the first player slot - Has a width of 1 and a height of 30 (an arbitrary value greater than the 25 total rows a roster could take up if all players were benched)
- Offsets from the team name location at
- The
IF(ISBLANK(...)...)function checks the array for blank values, inserting an empty string into the results array for blank rows found- When a non-blank row is found, its row value (
ROW(OFFSET(INDIRECT($D$4),2,1,30))) is added to the search array instead
- When a non-blank row is found, its row value (
SMALL(..., B9)is used to find the kth non-blank row in the search array (i.e., the kth row that has a player listed)- In this example, we're looking for the 1st player for this team, so the reference to
B9is a link to the number "1" - This is the only cell reference that changes going player to player (to
B10 = 2for player 2 and so on)
- In this example, we're looking for the 1st player for this team, so the reference to
- We subtract out the row number of the header (
ROW(INDIRECT($D$4))-1)) so we can use anINDEXfunction to return the value in the kth non-blank row
The above gives us a string containing a player's name, NFL team, and position (e.g., Philip Rivers, SD QB)
- First step is to parse out solely the player's name by searching for a comma and taking the text to the left of that position
=IFERROR(LEFT(C9,MIN(FIND(" ",C9,SEARCH(" ",C9)+1),SEARCH(",",C9))-1),"--")- The
IFERRORwrapper is for D/ST players (e.g.,Dolphins D/ST D/ST) who aren't given a comma between name and position- Since roster strength calculations don't include D/ST players, we're fine to ignore these rows
- The
- An
INDEX/MATCHsearches for the player's trade value in the "CBS" sheet- If the player isn't found, they're given the default unranked player value (hardcoded as 4)
=IFERROR(INDEX(CBS!I:I,MATCH(D9,CBS!E:E,0)),'Team Data'!$L$2)
The next step is to determine each team's positional corps (i.e., find the RB1, RB2, etc.)
- Columns for each position search the full name/team/position string for their respective position names ("QB", "RB", etc.)
=IF(IFERROR(FIND(G$8,RIGHT($C9,8)),0)>0,$E9+ROW()/1000,"-")- If the relevant string is found, that player's trade value is added to that position's column
- A small (
ROW/1000) tie-breaking adjustment is added in to avoid collisions in the ranking function - When consolidating for the final sheet output, the trade values used are the original, non-adjusted values
- A small (
After ranking each positional column's values, the ranks are used to populate a QB1, QB2, etc. table which is read in by the consolidated "Team Data" sheet.
- Write installation and usage documentation
- Extend functionality to other league sizes (8-, 10-, and 14-team leagues)
- Automate stats tracking across weeks
- Fully automate data collection
- Clean up VBA code to remove hard-coded references