Overview
Rearview is a monitoring framework for Graphite time series data. The monitors are simple Ruby scripts which are run in a sandbox to prevent I/O. Each monitor is configured with a crontab compatible time specification used by the scheduler.
Monitors define the following attributes:
- One or more Graphite metrics.
- Crontab time specification.
- Optional Ruby expression. If no custom graph calls are made a default graph is generated.
- Optional PagerDuty api keys and/or emails.
The monitor workflow is as follows:
-----------      ----------      --------------      -----sandbox----      --------
|scheduler| ---> |load job| ---> |graphite API| ---> | Ruby/monitor| ---> |alerts|
-----------      ----------      --------------      ----------------  |   --------
    ^                                                                  |
    |                                                                  |
    ----------------------------re-schedule-----------------------------
- Scheduler triggers job run
- Job is loaded from the database
- Server fetches the metrics from Graphite (note monitors can't do I/O other than puts)
- Metric data is transformed into data structures for Ruby
- MRI SAFE mode processes are forked to execute the logic
- Monitor optionally raises an exception to indicate a failure based on the data
- Any configured PagerDuty or Email alerts are sent
- Job is re-scheduled
A monitor is just a Ruby script which runs with some data in scope by default, that's all. The variables in scope to the monitor are generated from the job's definition of metrics and how far back to retrieve data. A monitor author can use the data in scope to determine whether an alert should be generated any way they see fit.
For example, let's suppose we calculate the conversion rate for our ad server over the last minute. If the conversion rate drops below 10% we want to generate an alert.
The add or edit monitor UI has several fields, but the most important fields are the metrics, number of minutes and the monitor Ruby expression field.
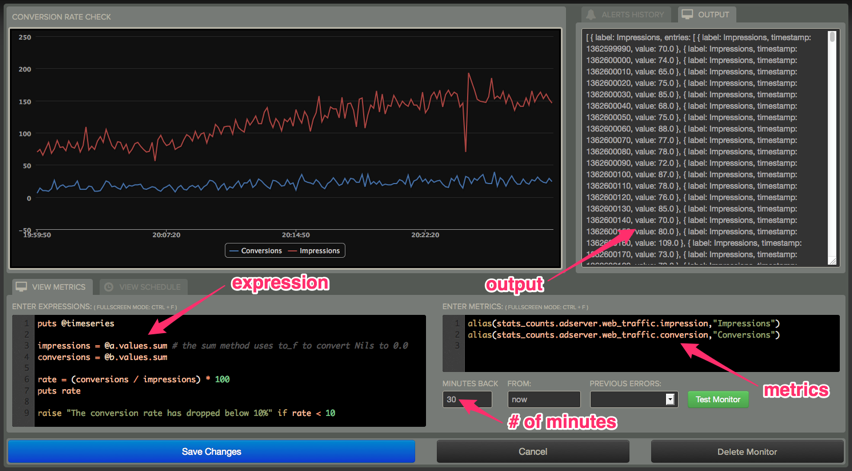
In this example, in the metrics field we would specify:
alias(stats_counts.adserver.web_traffic.impression, "impressions")
alias(stats_counts.adserver.web_traffic.conversion, "conversions")
By default the monitor will grab 1 minute's worth of data. Depending on your Graphite configuration this could be anywhere from 60 datapoints (for 1s retentions) or 6 (10s retentions are used for this example).
The monitor code would be defined as follows:
puts @timeseries

impressions = @a.values.sum # the sum method uses to_f to convert Nils to 0.0
conversions = @b.values.sum

rate = (conversions / impressions) * 100
puts rate

raise "The conversion rate has dropped below 10%" if rate < 10
By default, Rearview creates a namespace for the monitor with some implicit instance variables defined. In the above example we see @a and @b are referenced. The implicit instance variables are defined beginning with @a, which corresponds to the first metric in the list, @b which is the second metric and so on. In this example the timeseries for impressions is @a and conversions is @b. Each timeseries variable @a, @b, ... etc is a TimeSeries instance with the fields:
- label - the name of the metric for the timeseries (String). This value has an accessor which can be set to some other value for readability in graphs, etc.
- timestamp - a long value with the timestamp in milliseconds (Fixnum)
- value - the double value of the entry (may be Nil) (Float)
Additionally, there is a variable, @timeseries, in scope which is a an Array of TimeSeries objects represented above. So, the @a, @b, ... etc variables are just convenience variables which correspond to each entry of @timeseries in the order specified in the metrics UI text field. The string representation of @timeseries variable for the above example on 1 minute's worth of data would be:
[
    {
        label: impressions,
        entries: [
            { label: impressions, timestamp: 1361381120, value: 82.0 },
            { label: impressions, timestamp: 1361381130, value: 74.0 },
            { label: impressions, timestamp: 1361381140, value: 72.0 },
            { label: impressions, timestamp: 1361381150, value: 72.0 },
            { label: impressions, timestamp: 1361381160, value: 81.0 },
            { label: impressions, timestamp: 1361381170, value: 70.0 },
            { label: impressions, timestamp: 1361381180, value: nil }
        ]
    },
    {
        label: conversions,
        entries: [
            { label: conversions, timestamp: 1361381120, value: 17.0 },
            { label: conversions, timestamp: 1361381130, value: 17.0 },
            { label: conversions, timestamp: 1361381140, value: 17.0 },
            { label: conversions, timestamp: 1361381150, value: 11.0 },
            { label: conversions, timestamp: 1361381160, value: 18.0 },
            { label: conversions, timestamp: 1361381170, value: 6.0 },
            { label: conversions, timestamp: 1361381180, value: nil }
        ]
    }
]
Notice there are two array entries in @timeseries, which correspond to the variables @a and @b.
By default the label for each metric is set to the alias for a given timeseries. If an alias is not specified, the default value will match the exact string used in the metric field. Optionally, you can set the label manually within the monitor like this:
@a.label = "impressions"
@b.label = "conversions"
Back to the example:
The first line prints the @timeseries variable. All output from the monitor appears in the output field.
The next two lines sum the values of the two entries for impressions and conversions using the utility array method sum located in /src/main/resources/jruby/utilities.rb. This file also contains array methods for calculating mean, median, and percentile. Any method added to this file will be available to all monitors.
The next line calculates the conversion rate and then does a puts call which will be shown in the UI output field. Using puts is a handy way to debug the data initially and determine the shape of the data and so on.
Lastly, a monitor generates an alert by simply raising an exception with whatever text it wants to appear in an email or PagerDuty alert.
The following are the variables provided implicitly to a monitor:
- @name - Name of the monitor specified in the name field in the UI
- @minutes - Number of minutes specified in the minutes field in the UI
- @jobId - An id generated by the server for the job. This defaults to -1 for new monitors before saving.
- @timeseries - An 2-dimensional Array containing Hashes with the fields: metric, timestamp and value (see above description)
- @a, @b, ..., @z - If there are more than 26 metrics the variables wrap and begin again at @a1, @b1, etc (however, if you have more than 26 metrics you're likely doing something wrong)
There are a few utility functions also available to the monitor:
- with_metrics
- fold_metrics
- graph_value
The utility functions are better explained through an example:
impressions = 0
conversions = 0
rate = 0

with_metrics do |a, b|
  impressions += a.value.to_f
  conversions += b.value.to_f
  rate = (conversions / impressions) * 100
  graph_value["# of #{a.label}", a.timestamp, a.value]
  graph_value["# of #{b.label}", b.timestamp, b.value]
  graph_value["Conversion Rate", a.timestamp, rate]
end

raise "The conversion rate has dropped below 10%." if rate < 10
In this example we're using one of the utility functions, with_metrics and graph_value.
The with_metrics function is a convenience function which introduces variables to the passed block which all align to the same timeslice in the time series. So in the example, a corresponds to impressions and b conversions. Each iteration through the block has the successive timestamp until the end of the series.
graph_value will plot on the graph the specified value for the timestamp given. In the example the resulting graph will render 3 lines, with the labels "# of Impressions", "# of Conversions" and "Conversion Rate".