![]()
English | 中文
Loggie is a lightweight, high-performance, cloud-native agent and aggregator based on Golang.
- Supports multiple pipeline and pluggable components, including data transfer, filtering, parsing, and alerting.
- Uses native Kubernetes CRD for operation and management.
- Offers a range of observability, reliability, and automation features suitable for production environments.
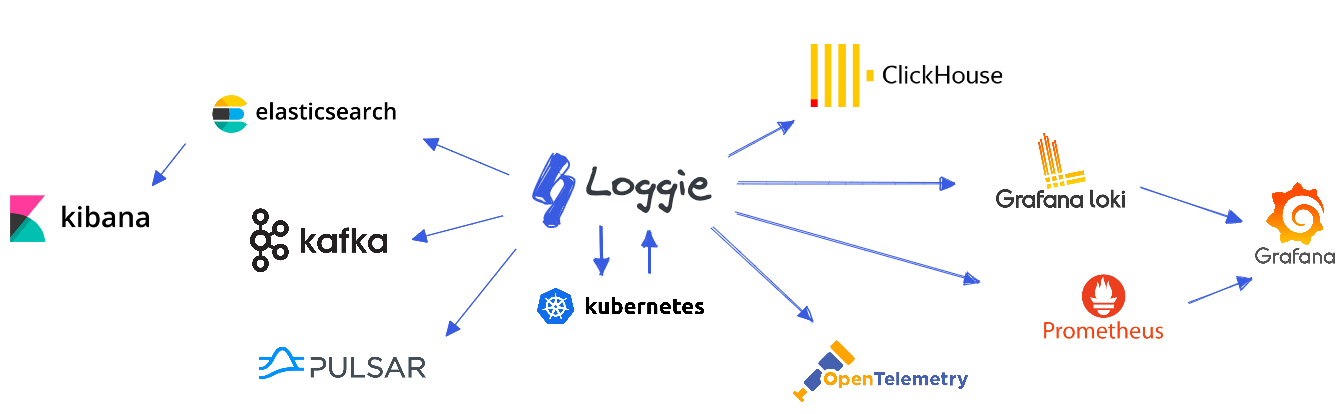
Based on Loggie, we can build a cloud-native scalable log data platform.
Loggie includes LogConfig/ClusterLogConfig/Interceptor/Sink CRDs, allowing for the creation of data collection, transfer, processing, and sending pipelines through simple YAML file creation.
eg:
apiVersion: loggie.io/v1beta1
kind: LogConfig
metadata:
  name: tomcat
  namespace: default
spec:
  selector:
    type: pod
    labelSelector:
      app: tomcat
  pipeline:
    sources: |
      - type: file
        name: common
        paths:
          - stdout
          - /usr/local/tomcat/logs/*.log
    sinkRef: default
    interceptorRef: default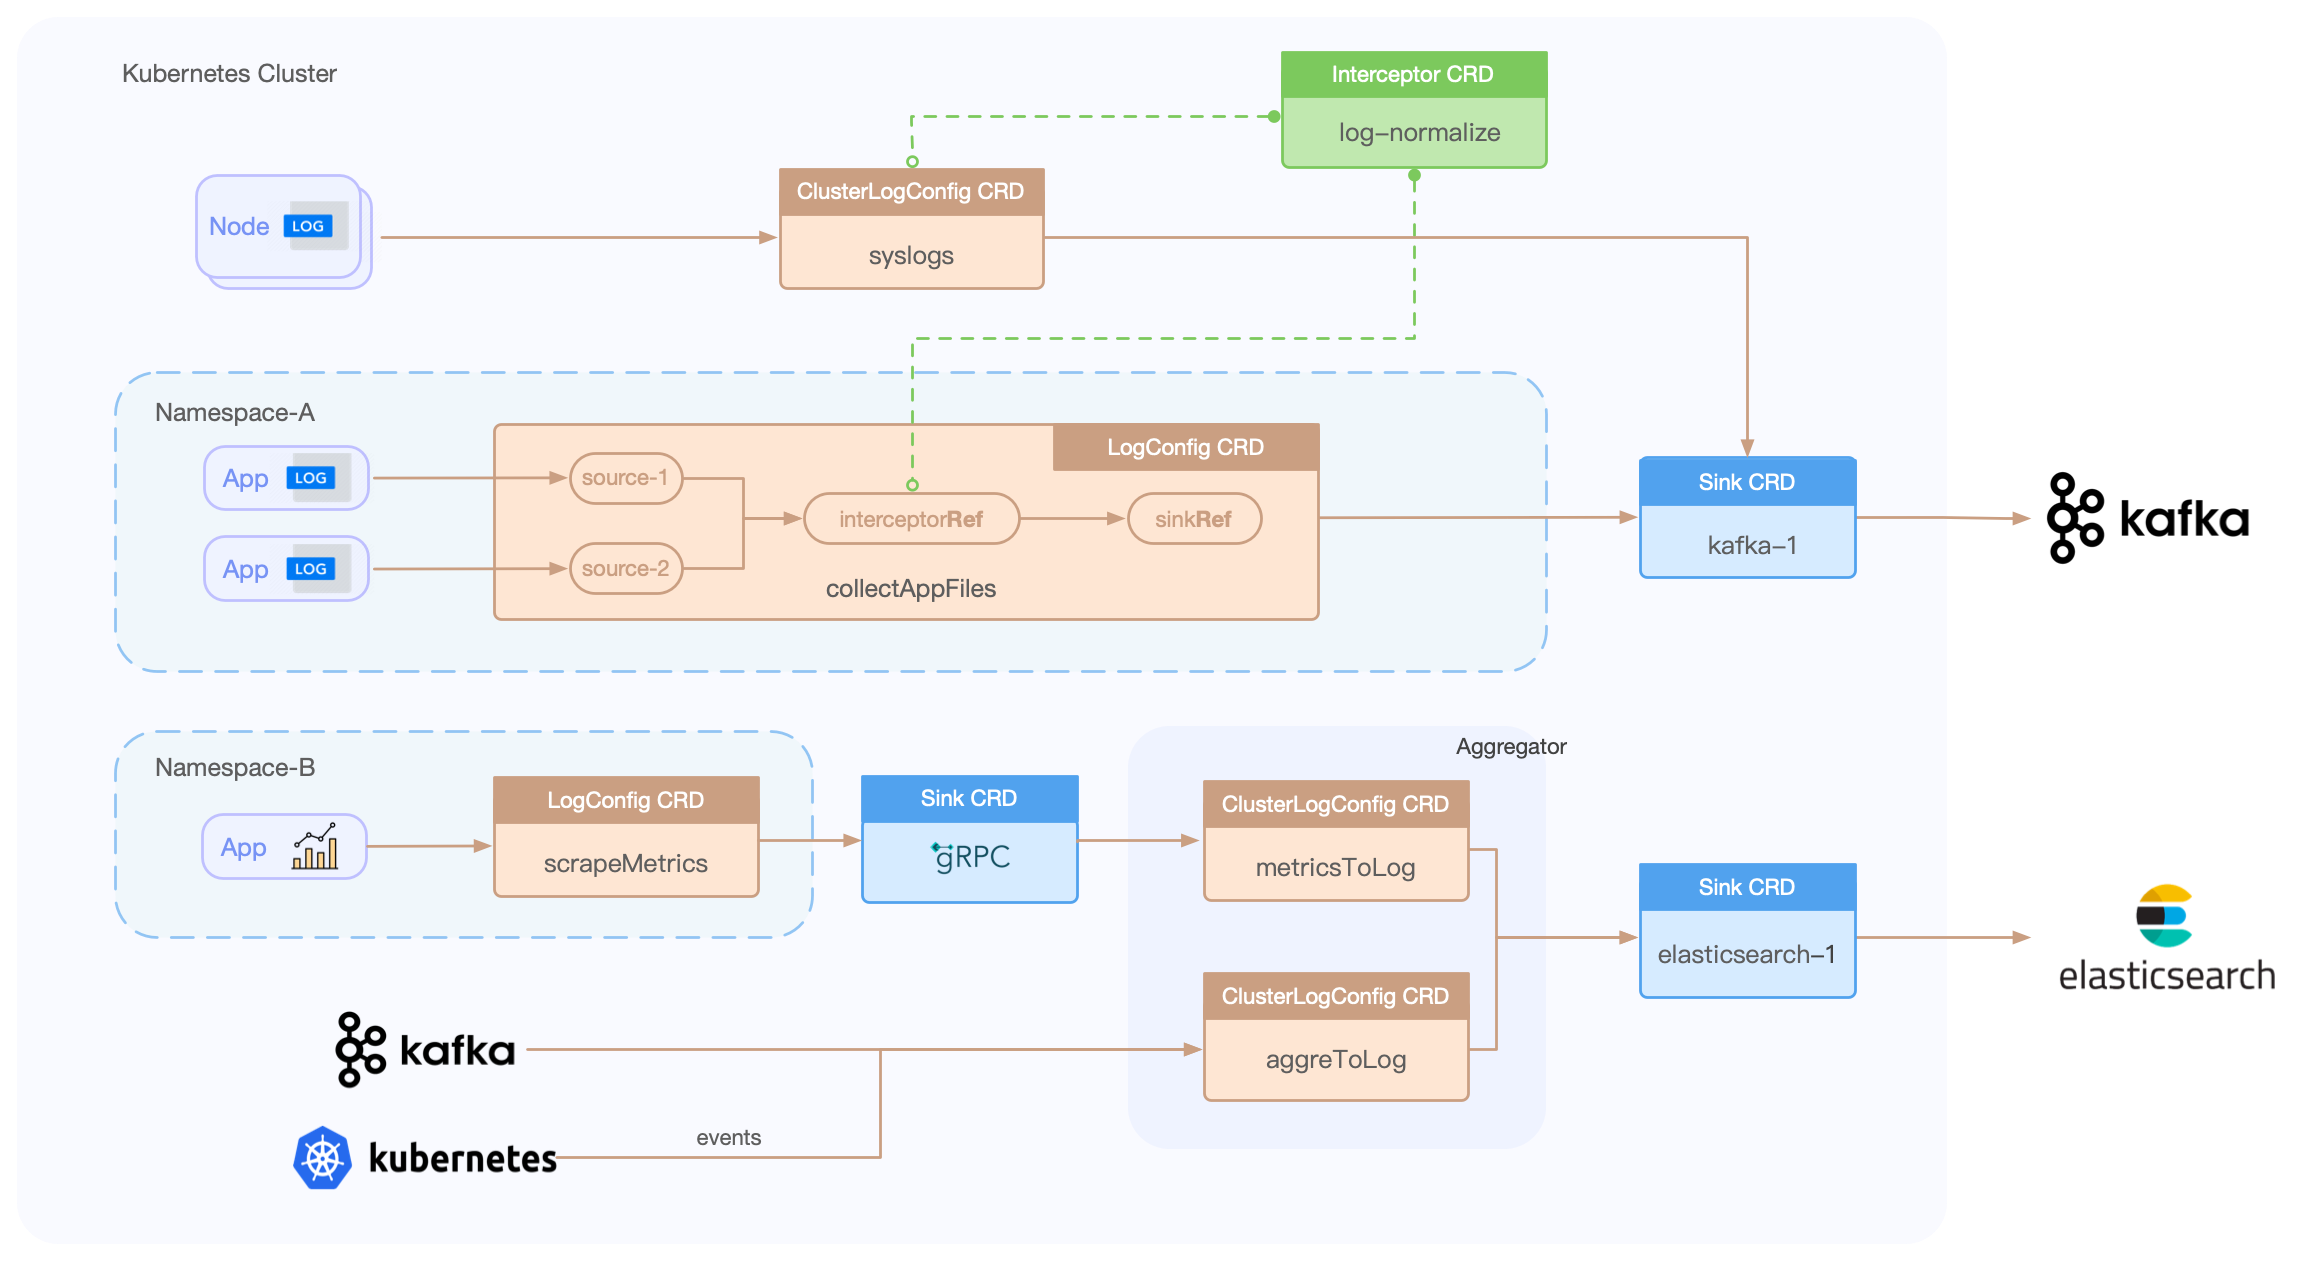
-
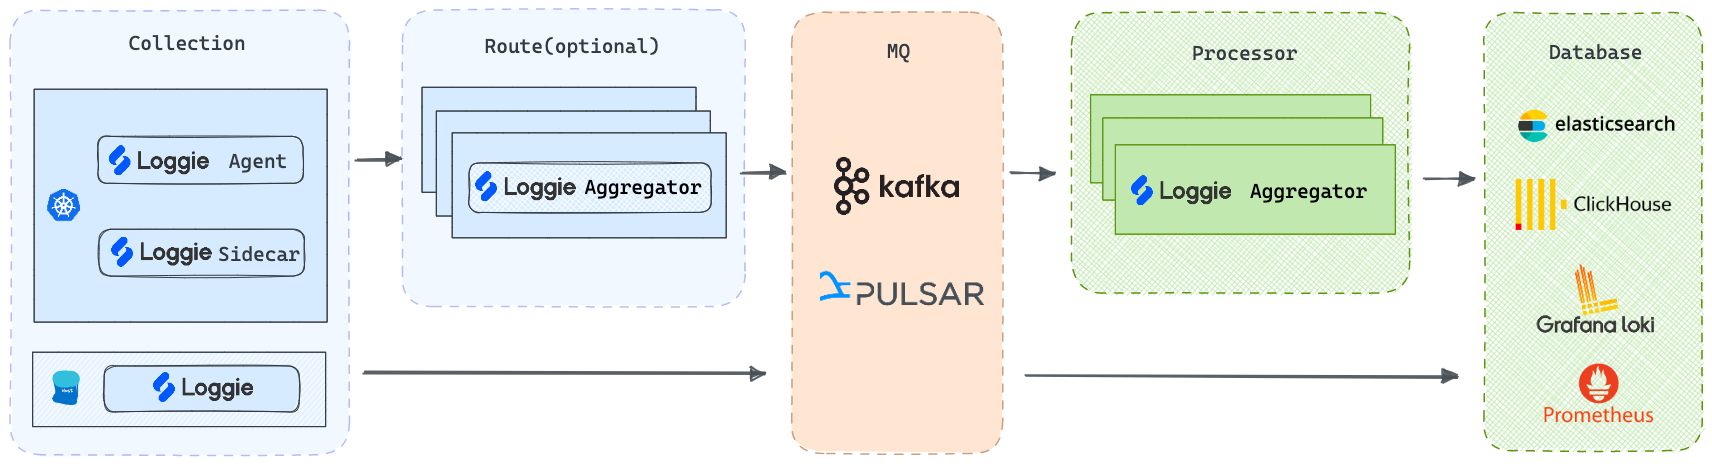
Agent: Deployed via DaemonSet, Loggie can collect log files without the need for containers to mount volumes.
-
Sidecar: Supports non-intrusive auto-injection of Loggie sidecars, without the need to manually add them to the Deployment/StatefulSet templates.
-
Aggregator: Supports deployment as an independent intermediate machine, which can receive aggregated data sent by Loggie Agent and can also be used to consume and process various data sources.
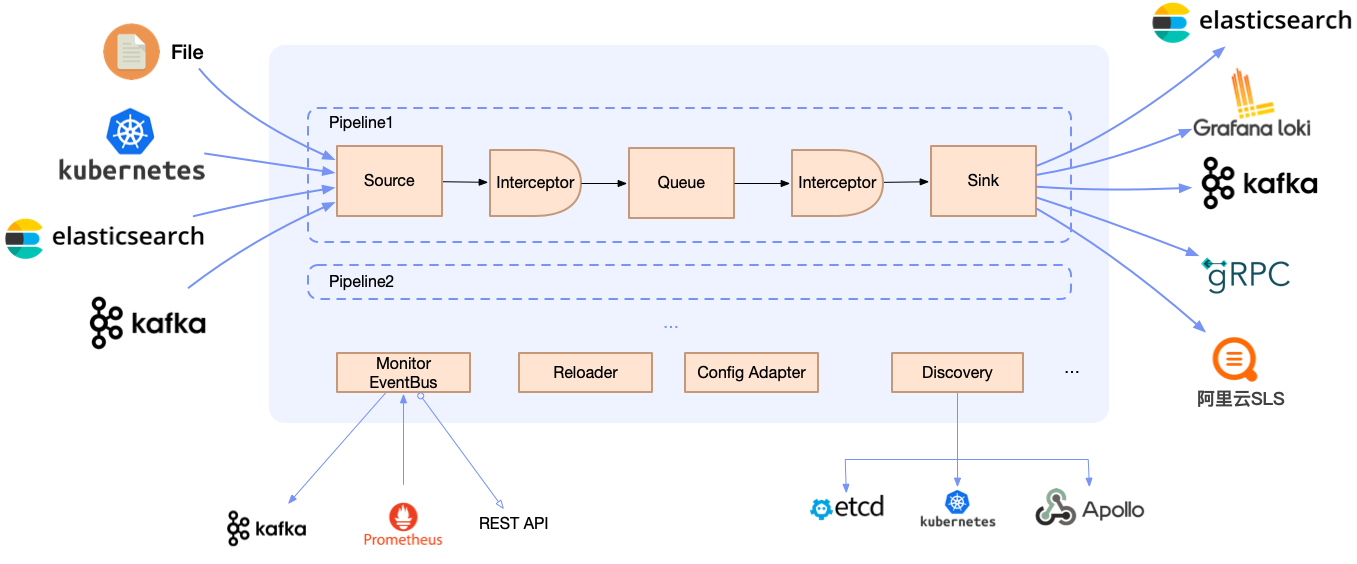
But regardless of the deployment architecture, Loggie still maintains a simple and intuitive internal design.
Configure Filebeat and Loggie to collect logs, and send them to a Kafka topic without using client compression, with the Kafka topic partition configured as 3.
With sufficient resources for the Agent specification, modify the number of files collected, the concurrency of the sending client (configure Filebeat worker and Loggie parallelism), and observe their respective CPU, memory, and pod network card transmission rates.
| Agent | File Size | File Count | Sink Concurrency | CPU | MEM (rss) | Transmission Rates |
|---|---|---|---|---|---|---|
| Filebeat | 3.2G | 1 | 3 | 7.5~8.5c | 63.8MiB | 75.9MiB/s |
| Filebeat | 3.2G | 1 | 8 | 10c | 65MiB | 70MiB/s |
| Filebeat | 3.2G | 10 | 8 | 11c | 65MiB | 80MiB/s |
| Loggie | 3.2G | 1 | 3 | 2.1c | 60MiB | 120MiB/s |
| Loggie | 3.2G | 1 | 8 | 2.4c | 68.7MiB | 120MiB/s |
| Loggie | 3.2G | 10 | 8 | 3.5c | 70MiB | 210MiB/s |
With sink concurrency configuration enabled, Loggie can:
- Automatically adjust the downstream data sending parallelism based on the actual downstream data response, making full use of the downstream server's performance without affecting its performance.
- Adjust the downstream data sending speed appropriately when upstream data collection is blocked to relieve upstream blocking.
Logs are a universal data type and are not related to platforms or systems. How to better utilize this data is the core capability that Loggie focuses on and develops.
With the configuration of transformer interceptors and the configuration of functional actions, Loggie can achieve:
- Parsing of various data formats (json, grok, regex, split, etc.)
- Conversion of various fields (add, copy, move, set, del, fmt, etc.)
- Support for conditional judgment and processing logic (if, else, return, dropEvent, ignoreError, etc.)
eg:
interceptors:
  - type: transformer
    actions:
      - action: regex(body)
        pattern: (?<ip>\S+) (?<id>\S+) (?<u>\S+) (?<time>\[.*?\]) (?<url>\".*?\") (?<status>\S+) (?<size>\S+)
      - if: equal(status, 404)
        then:
          - action: add(topic, not_found)
          - action: return()
      - if: equal(status, 500)
        then:
- action: dropEvent()Helps you quickly detect potential problems and anomalies in the data and issue timely alerts. Support custom webhooks to connect to various alert channels.
Supports matching methods such as:
- No data: no log data generated within the configured time period.
- Fuzzy matching
- Regular expression matching
- Conditional judgment
- Field comparison: equal/less/greater...
Often, metric data is not only exposed through prometheus exporters, but log data itself can also provide a source of metrics. For example, by counting the access logs of a gateway, you can calculate the number of 5xx or 4xx status codes within a certain time interval, aggregate the qps of a certain interface, and calculate the total amount of body data, etc.
eg:
- type: aggregator
  interval: 1m
  select:
    # operator:COUNT/COUNT-DISTINCT/SUM/AVG/MAX/MIN
    - {key: amount, operator: SUM, as: amount_total}
    - {key: quantity, operator: SUM, as: qty_total}
  groupBy: ["city"]
  calculate:
- {expression: " ${amount_total} / ${qty_total} ", as: avg_amount}-
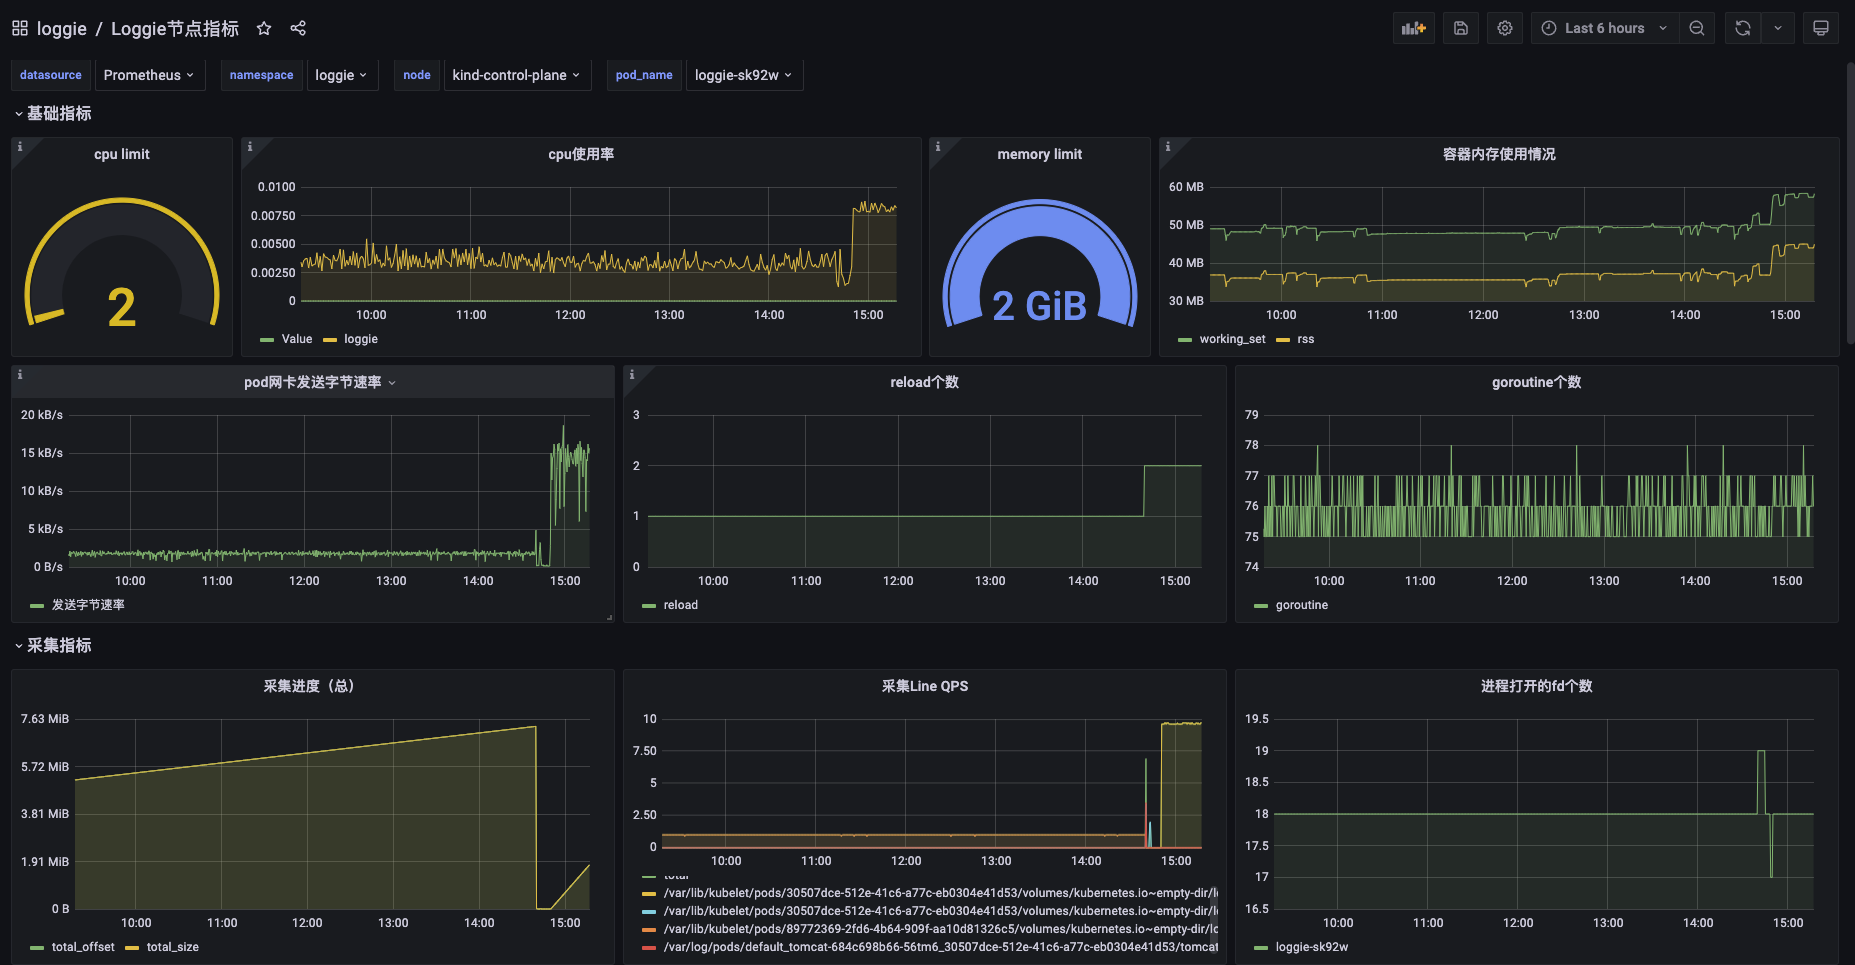
Loggie provides configurable and rich metrics, and dashboards that can be imported into Grafana with one click.
-
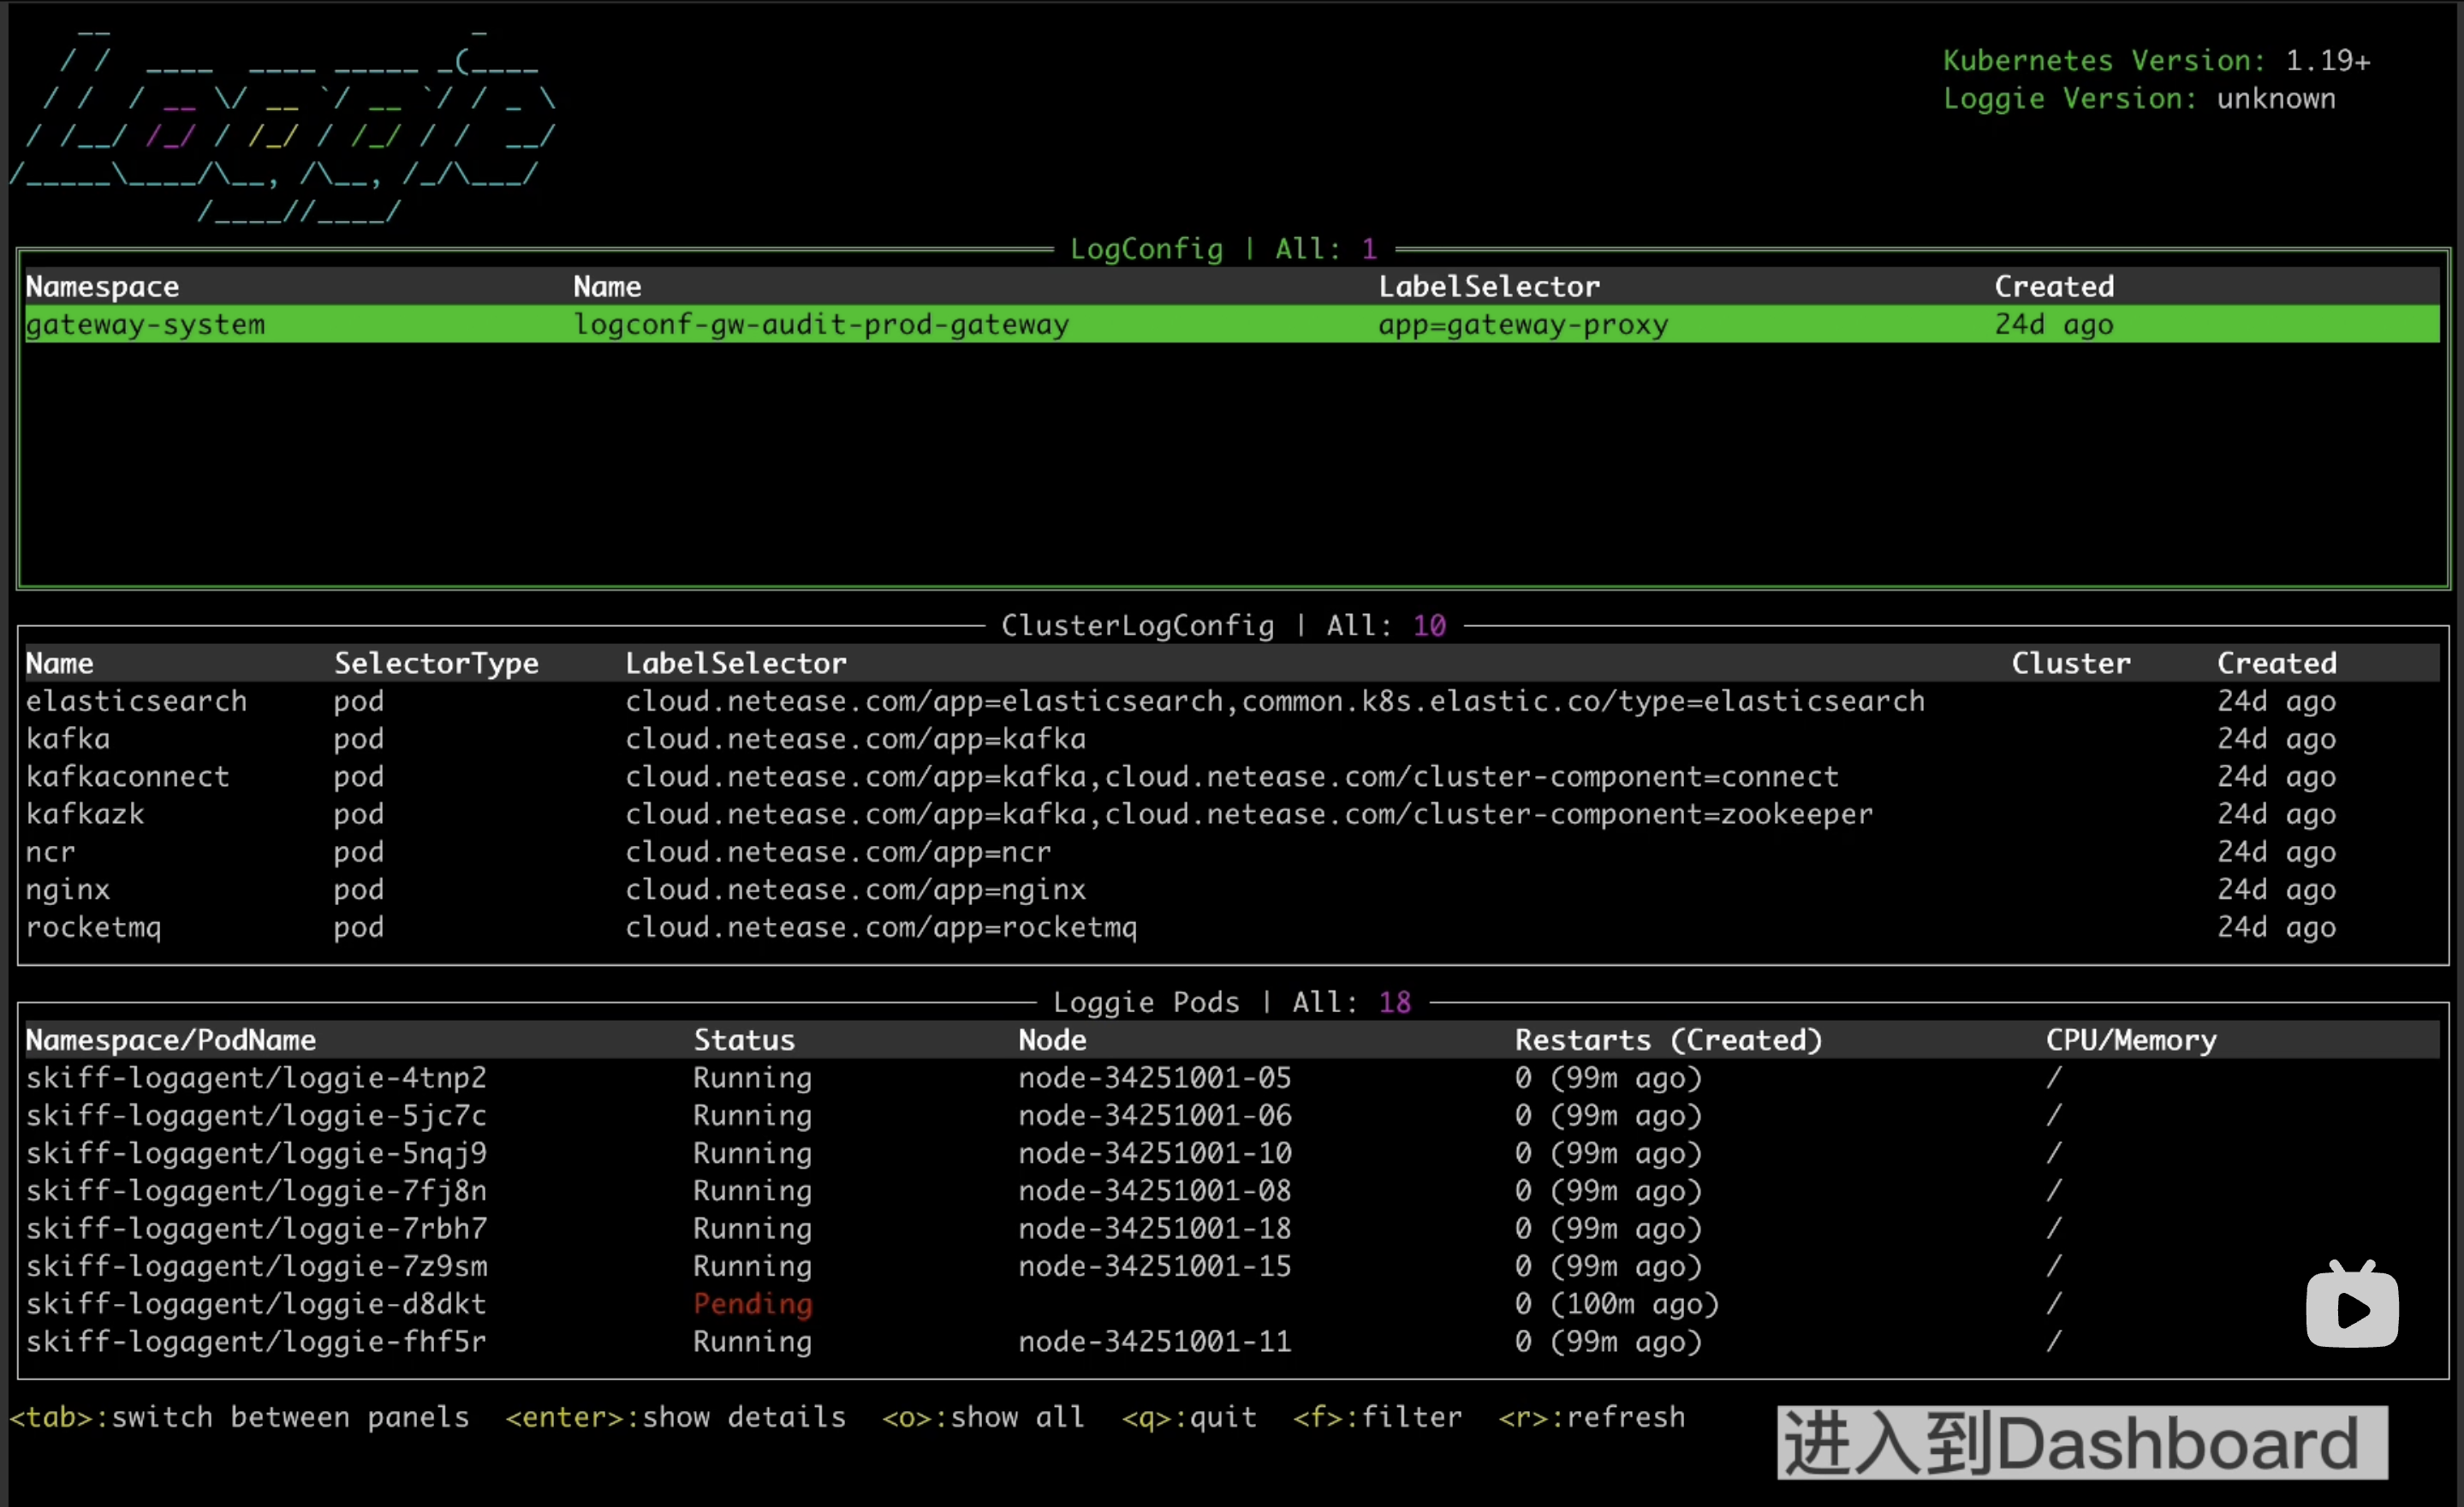
Quickly troubleshoot Loggie itself and any problems in data transmission by Loggie terminal.
| Loggie | Filebeat | Fluentd | Logstash | Flume | |
|---|---|---|---|---|---|
| Language | Golang | Golang | Ruby | JRuby | Java |
| Multiple Pipelines | ✓ | single queue | single queue | ✓ | ✓ |
| Multiple output | ✓ | one output | copy | ✓ | ✓ |
| Aggregator | ✓ | ✓ | ✓ | ✓ | ✓ |
| Log Alarm | ✓ | ||||
| Kubernetes container log collection | support container stdout and logs files in container | stdout | stdout | ||
| Configuration delivery | through CRD | manual | manual | manual | manual |
| Monitoring | support Prometheus metrics,and can be configured to output indicator log files separately, sending metrics, etc. | prometheus metrics | need exporter | need exporter | |
| Resource Usage | low | low | average | high | high |
- Quickstart
- Installation (Kubernetes, Node)
- Args
- System
- Pipelines
- Source: file, kafka, kubeEvent, grpc, elasticsearch, prometheusExporter..
- Sink: elasticsearch, kafka, grpc, loki, zinc, alertWebhook, dev..
- Interceptor: transformer, schema, limit, logAlert, maxbytes..
- CRD: LogConfig, ClusterLogConfig, Sink, Interceptor
Pull requests, comments and suggestions are welcome.
Please see CONTRIBUTING.md for more information.