Logseq on Linux is still very CPU hungry #4175
Comments
|
Any error noticed in console? |
|
Thanks for getting back to me! Console output: $ ./Logseq
[27117:0209/205426.135032:ERROR:sandbox_linux.cc(374)] InitializeSandbox() called with multiple threads in process gpu-process.
20:54:27.508 › Logseq App(0.5.9) Starting... That's all. |
|
This is partly related to #4119. It's not only the CPU but the GPU as well. I'm getting the same message as well. |
|
@Haptein seems that you get a libva error in addition to the error I get. In my case, mainly the CPU consumption is high but maybe it is related to a GPU problem since I do not have a dedicated GPU.
|

|
@l8l What I showed was on a mobile intel iGPU using intel-gpu-overlay. I'm honestly not sure if the libva error is related to this but I think it's good that you pointed it out. |
|
I have a constant 20% usage of one CPU core even when the app has been idle for hours and only a basic page is displayed (with no plugin activated). That only seems to happen after I've opened (and closed) the graph view. Is this the same issue or should I create a new issue? OS: Kubuntu 21.10 Hardware: Intel i7, 16GB RAM |
|
All recent releases of Logseq uses approximately 15% of my CPU when open, even if I'm not interacting with the program at all. |
|
I've observed the same behavior on my system. For single-core utilization, logseq idles between approximately 11% - 15% for me. This seems to happen regardless of how I have used the program. Here is the view of logseq in Gnome System Monitor when I disable "divide cpu use by number of cpus".
Logseq: 0.7.4 from flathub |

|
I've now tested this both with Logseq from flathub, which runs in When running the appimage with OzonePlatform it was missing the title bar. However I verified that it was running in wayland, and I was able to load one of my graphs in it. From a quick spot test, it appeared that the CPU use was roughly the same between the flatpak running in |
|
I have the same problem. Logseq, while idle, chews up about 20% of a CPU core. I'm using version 0.7.6, installed via flatpak, on Fedora 36 (with Wayland). By comparison, the Obsidian desktop app consumes barely anything. |
|
@JuneKelly @bpauw @andre-sb |
|
@cnrpman I seem to be getting better performance now than I did before. I'm using logseq 0.7.6 at the moment. Between the two active logseq processes, it seems to be idling at roughly 4.5-6%. |
|
Update: I get the same results when logged in to an Xorg session. So it seems to be independent of Wayland/Xorg. EDIT: I also don't recall when the problem began. I just noticed the machine seemed to be under an unusual amount of pressure considering what was running, and that prompted me to check the performance monitor. |
|
@cnrpman I noticed the issue since I started using Logseq in January/22. Sorry I can't recall the exact version. |
|
I've been watching LogSeq's idle CPU usage over the past 3 days, and it seems to be quite variable. In my test from 2 days ago, I booted up Logseq and tried viewing a few pages that I thought had high cpu usage before. In that test, none of them seemed to go above 4.5-6%. I usually keep Logseq open all day, and so I've been keeping an eye on the cpu usage as I go about my day. When I check I'll always watch the cpu monitor for a few seconds to give Logseq a chance to level off its cpu usage. Yesterday and today I've seen my logseq instance idle cpu at 4.5%, 15%, 30%, and (currently) 70% (single core equivalent). I'm not sure how to be more helpful in diagnosing this because I can't seem to intentionally replicate this. When I start logseq from cold, it usually idles at 4.5 - 6% (single core equivalent). But when I leave it on throughout the day I see all kinds of widely varying amounts of cpu use when it is idling. |
|
It seems like are reported cpu usage issues are from linux based operating systems, so far. In my case, this issue occures not only on my debian based workstation, but also my windows11-based laptop utilizing a up-to-date cpu (and gpu). If i recall correctly, these kind of problems started for me during the last months.... |
|
@winterlich Sound it's related to the content. There's another report on Windows, which says has realized the lag for a while: #6198 |
|
Do you guys use flashcards? How many cards do you have? This might be an issue related to cards because logseq will calculate the cards periodically. If possible, can anyone send us a recorded profile? Figma has a nice short post on how to record a performance profile here https://help.figma.com/hc/en-us/articles/360041468414-Record-a-Chrome-Performance-Profile. |
|
Sounds to be related to #6152 if it's related to the number of cards |
|
I don't use flashcards and still get very high CPU usage. Even for a small graph with just a few pages.
…________________________________
De: Junyi Du ***@***.***>
Enviado: quinta-feira, 28 de julho de 2022 03:47
Para: logseq/logseq ***@***.***>
Cc: andre-sb ***@***.***>; Mention ***@***.***>
Assunto: Re: [logseq/logseq] Logseq on Linux is still very CPU hungry (Issue #4175)
Sounds to be related to #6152<#6152> if it's related to the overwhelming number of cards
—
Reply to this email directly, view it on GitHub<#4175 (comment)>, or unsubscribe<https://github.com/notifications/unsubscribe-auth/AHJXPBAQFXCBOWFEHPU7J33VWI3HRANCNFSM5N5F73SQ>.
You are receiving this because you were mentioned.Message ID: ***@***.***>
|
|
@andre-sb Thank you for your information. |
|
I don't use flashcards, and I don't have that many pages/nodes. |
|
@andre-sb @JuneKelly Can you record a profile and share?
|
|
Sure, here's a 20-second profile with logseq sitting idle: https://www.dropbox.com/s/jnahdux6ln7q13v/june-k-logseq-profile-20220801.json?dl=0 |
|
@JuneKelly Interesting. Seems the JS process of Logseq is quite idle according to the performance profile... |
|
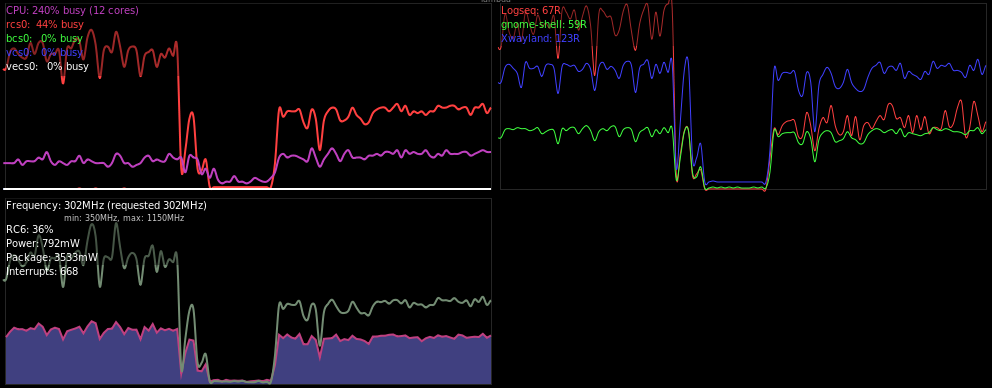
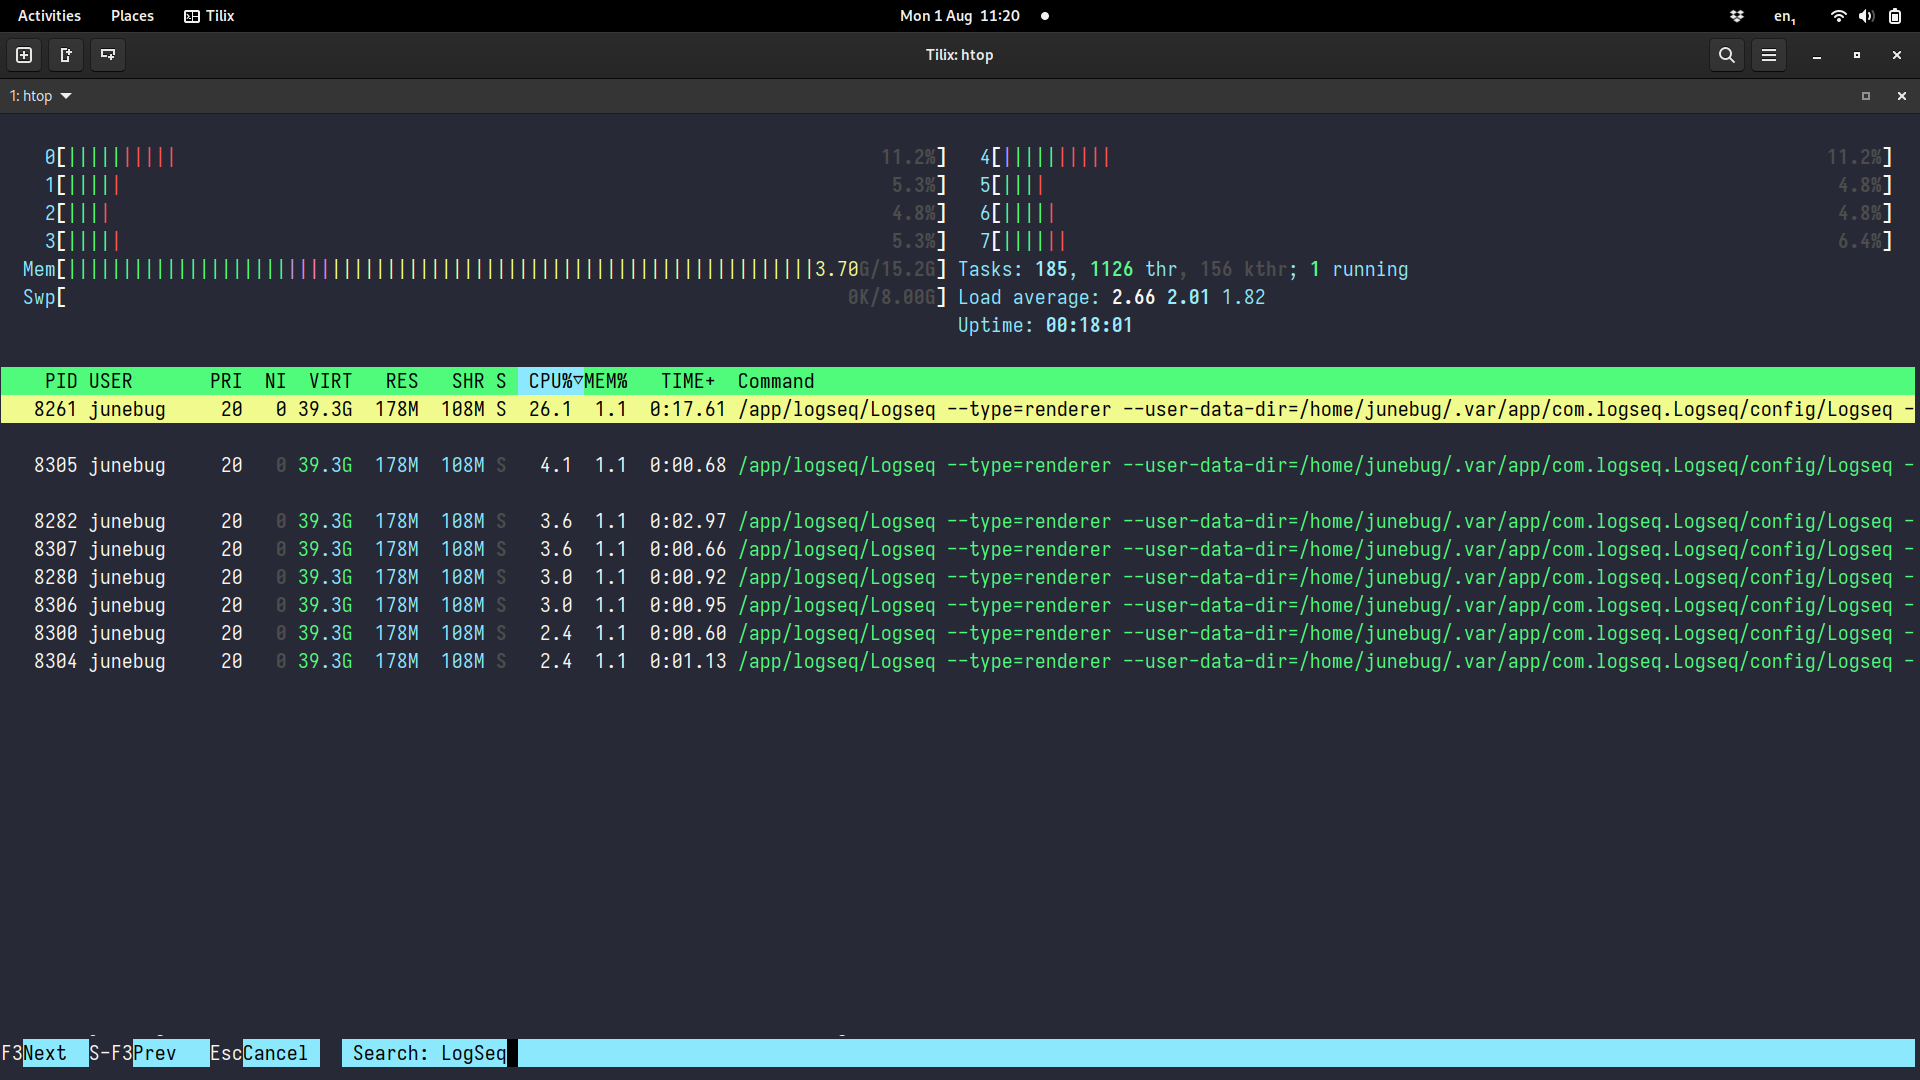
Interesting. I wonder if this is relevant? In htop, it's these processes with
|
|
@JuneKelly Sounds to be an issue of the upstream (electron). |
|
I am also facing the same issue, but I noticed that when local graph is shown in the sidebar, the cpu usage Maybe this information would be helpful to debug the problem. Let me know if you want any logs , video etc. |
FWIW this is similar to what I experienced on #4119. |
@cnrpman, here is a short profile, hope it helps: |
|
I’m facing the same problem. I use Logseq in Flatpak on Linux (5.15.57), Sway, XWayland (Logseq doesn’t even start in wayland mode due to electron/electron#32487), integrated GPU. I just started using it, so my graph is tiny, no flashcards. |
|
Any update on this? |
What happened?
In this recent issue, many people described that logseq was extremely CPU hungry on Linux. The issue was closed after some people reported that the nightly build of logseq helped them to resolve the issue.
Unfortunately, the issue persists even if I install the nightly build and thus I request to re-open the issue.
Background data of my system
OS: Arch Linux, Gnome Desktop
Hardware: Intel i5, dual core, 8GB RAM
Detailed problem description
Even when just scrolling through a page without any images, logseq uses about 16% of the CPU. If I additionally open a graph (with only 3 nodes for example) on the right hand side, then it jumps to over 30%. My fans go wild as well whenever I open the side bar. This presently makes logseq unfortunately unusable for me.
As I wrote, I ran the nightly build (and previously uninstalled my old version) and the issue persists. I can see in the settings menu that I am really running the nightly release ("0.5.9+nightly.20220129").
Thanks a lot for considering this issue again.
The text was updated successfully, but these errors were encountered: