A plugin for BPMN diagrams that visualizes performance metrics directly on the diagram. This plugin is essential for analyzing and understanding the performance of complex BPMN workflows, allowing you to easily visualize and identify key performance metrics for each element.
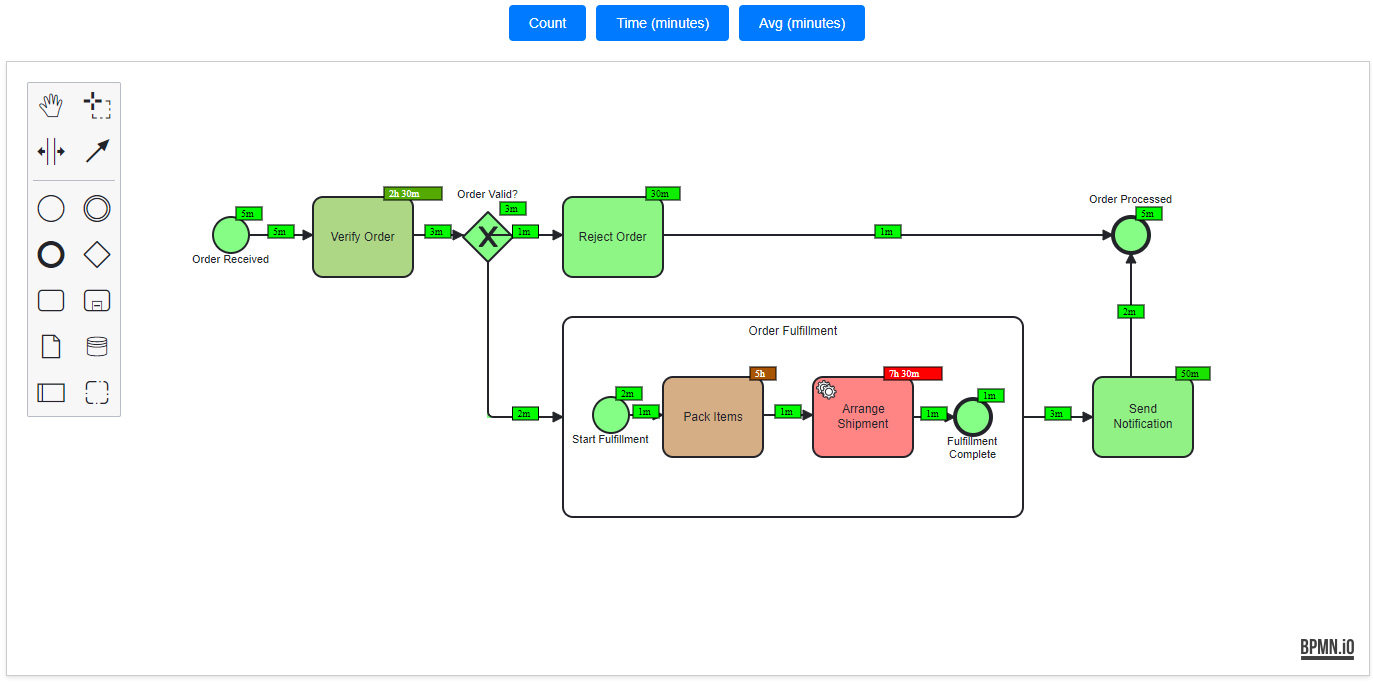
- Performance Metrics Display: Automatically displays performance metrics (count, time in minutes, average time in minutes) of BPMN elements.
- Customizable: Easily toggle between different performance metrics.
- Seamless Integration: Works with BPMN-js out of the box.
- Development and Production Builds: Optimized builds for both development and production environments.
You can see a live demo of this project here.
First, install the plugin using npm:
npm install bpmn-js-performance-visualizerHere is an example of how to use the bpmn-js Performance Visualizer plugin with BpmnModeler:
import BpmnModeler from 'bpmn-js/lib/Modeler';
import BpmnPerformanceVisualizer from 'bpmn-js-performance-visualizer';
import diagramXML from './diagram.bpmn';
import stats from './stats.json';

const modeler = new BpmnModeler({
  container: canvas,
  additionalModules: [
    BpmnPerformanceVisualizer
  ],
  keyboard: {
    bindTo: document
  }
});

const monitoring = modeler.get('bpmnPerformanceVisualizer');
monitoring.setStats(stats);

modeler.importXML(diagramXML, function(err) {
  if (err) {
    console.error('Error importing BPMN diagram', err);
  } else {
    console.log('BPMN diagram imported successfully');
  }
});To start the development server, run:
npm startTo build the library for production, run:
npm run buildThis will create a bundled file bpmn-js-performance-visualizer.bundle.js in the dist directory.
To lint the code and automatically fix issues, run:
npm run lintThis project was inspired by bpmn-visualization-js.
This project is licensed under the ISC License - see the LICENSE file for details.
Przemysław Niedziela - GitHub
Feel free to modify and extend the project to suit your needs!