FIO is a tool for benchmarking storage devices. FIO helps to assess the storage performance in terms of IOP/s and latency.
Fio-plot generates charts from FIO storage benchmark data. It can process FIO output in JSON format. It can also process FIO log file output (in CSV format). It also includes bench-fio, a benchmark tool to automate benchmarking with FIO. Checkout the many examples below.
To make these charts yourself, you need to follow this process:
- Run your tests, maybe use the included benchmark script bench-fio
- Determine which information you would like to show
- Run fio-plot to generate the images with the appropriate command line options
Ubuntu 18.04+ LTS: please run this command first:
apt install zlib1g-dev libjpeg-dev python3-pip
All operating systems:
pip3 install fio-plot
If you want to use the benchmark script bench-fio, make sure to install Fio too.
If you don't want to install fio-plot system-wide, you can make a virtual environment like this:
cd /desired/path
python3 -m venv fio-plot
source fio-plot/bin/activate
pip3 install fio-plot
When you source the virtual environment, fio-plot and bench-fio will be in your executable path.
If you want to install from source, you can clone the repository and run
python3 setup.py install
Fio-plot supports configuration through command-line parameters or using an INI format configuration file. The examples provided in the following sections use command-line parameters.
This is how you use an INI configuration file (instead):
fio-plot /path/to/fio-plot.ini
An example INI is inclued in the fio_plot/templates/fio-plot.ini file. It looks like this:
[graphtype]
graphtype = bargraph2d_qd

[settings]
input_directory = /path/to/benchmarkdata
output_filename = test.png
title = Title
subtitle =
source = https://louwrentius.com
rw = randread
type =
...
- The fio-plot --help command explains the usage of the parameters available in the INI.
- You can't use both the INI file and command-line options, you have to pick one.
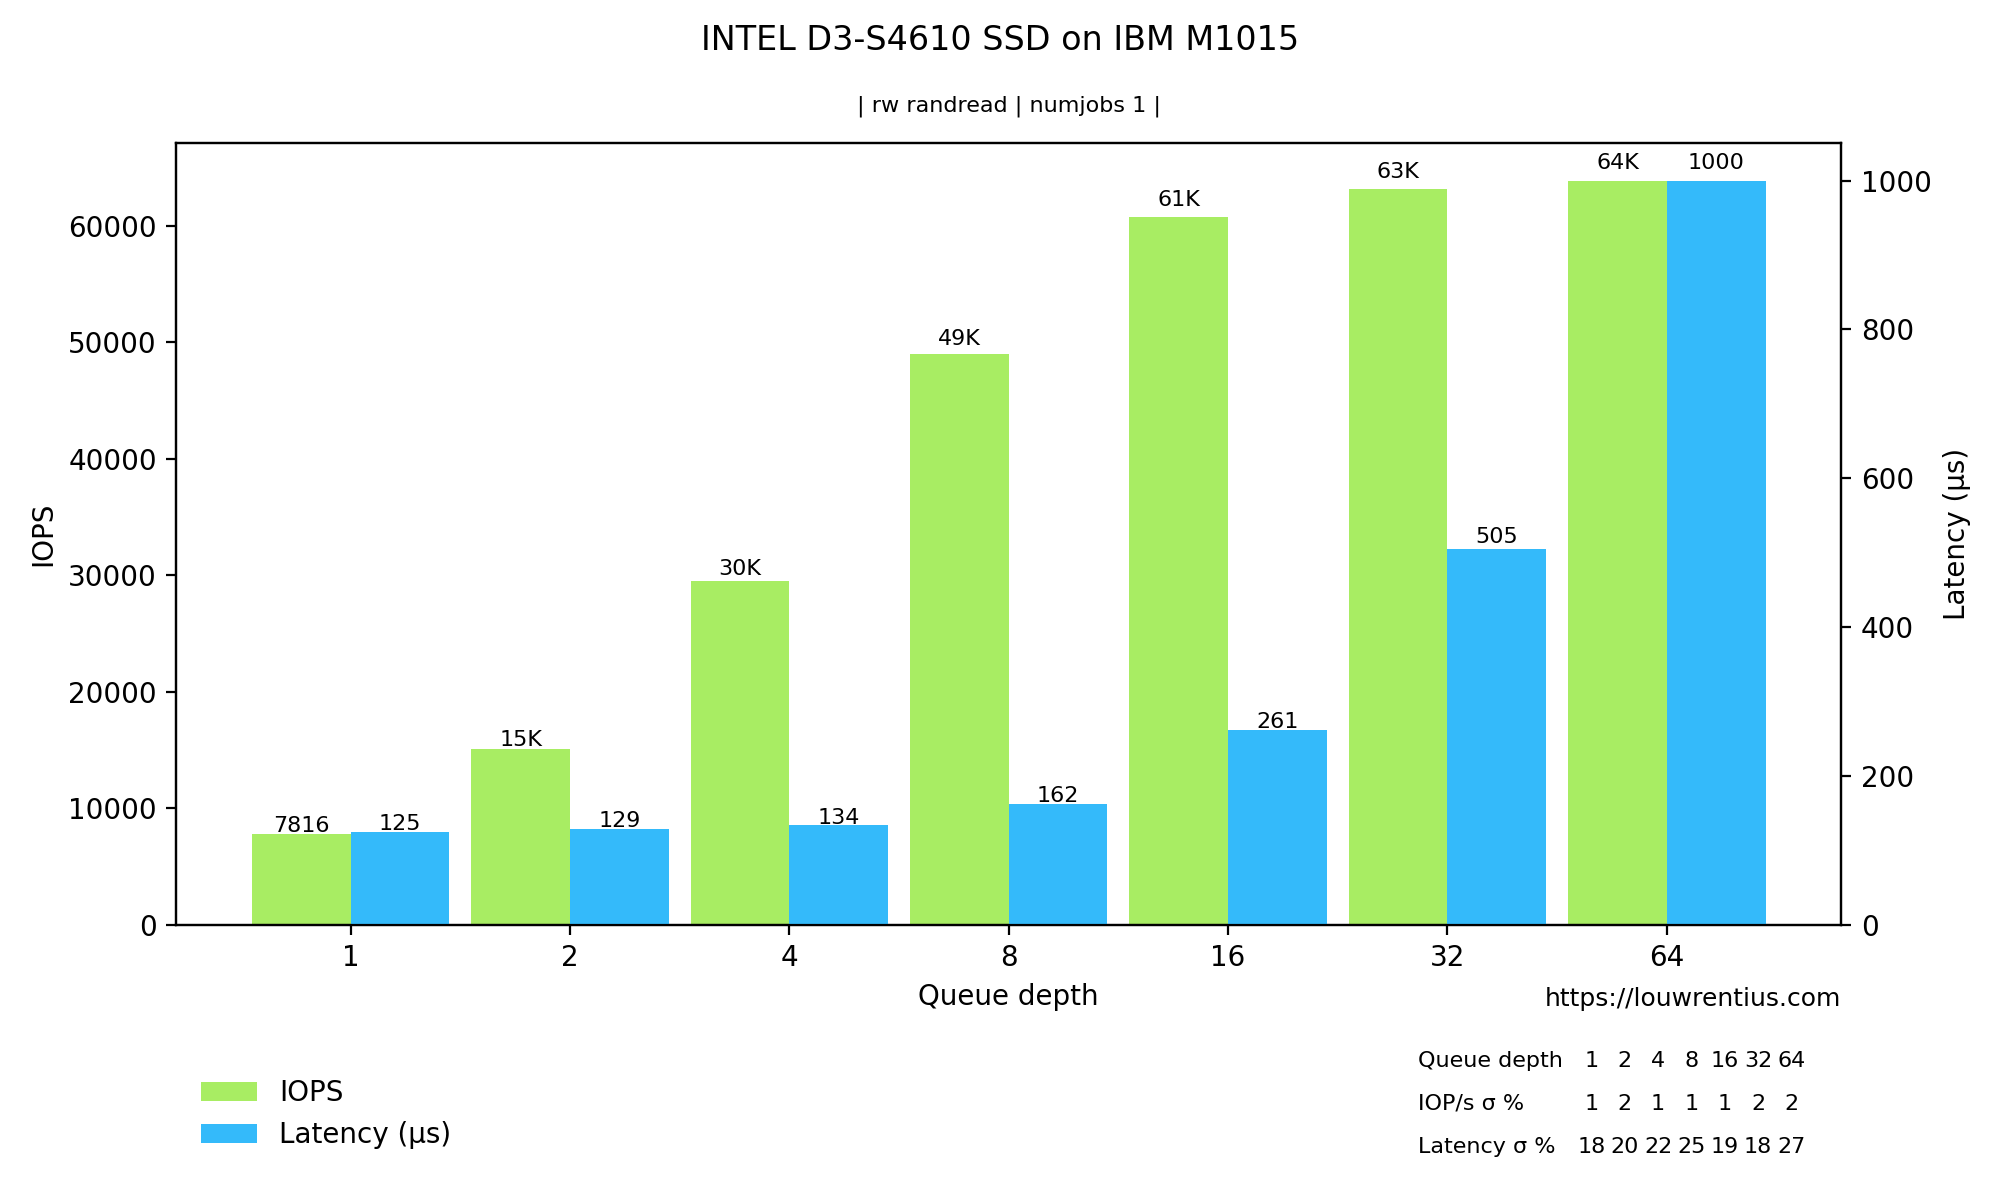
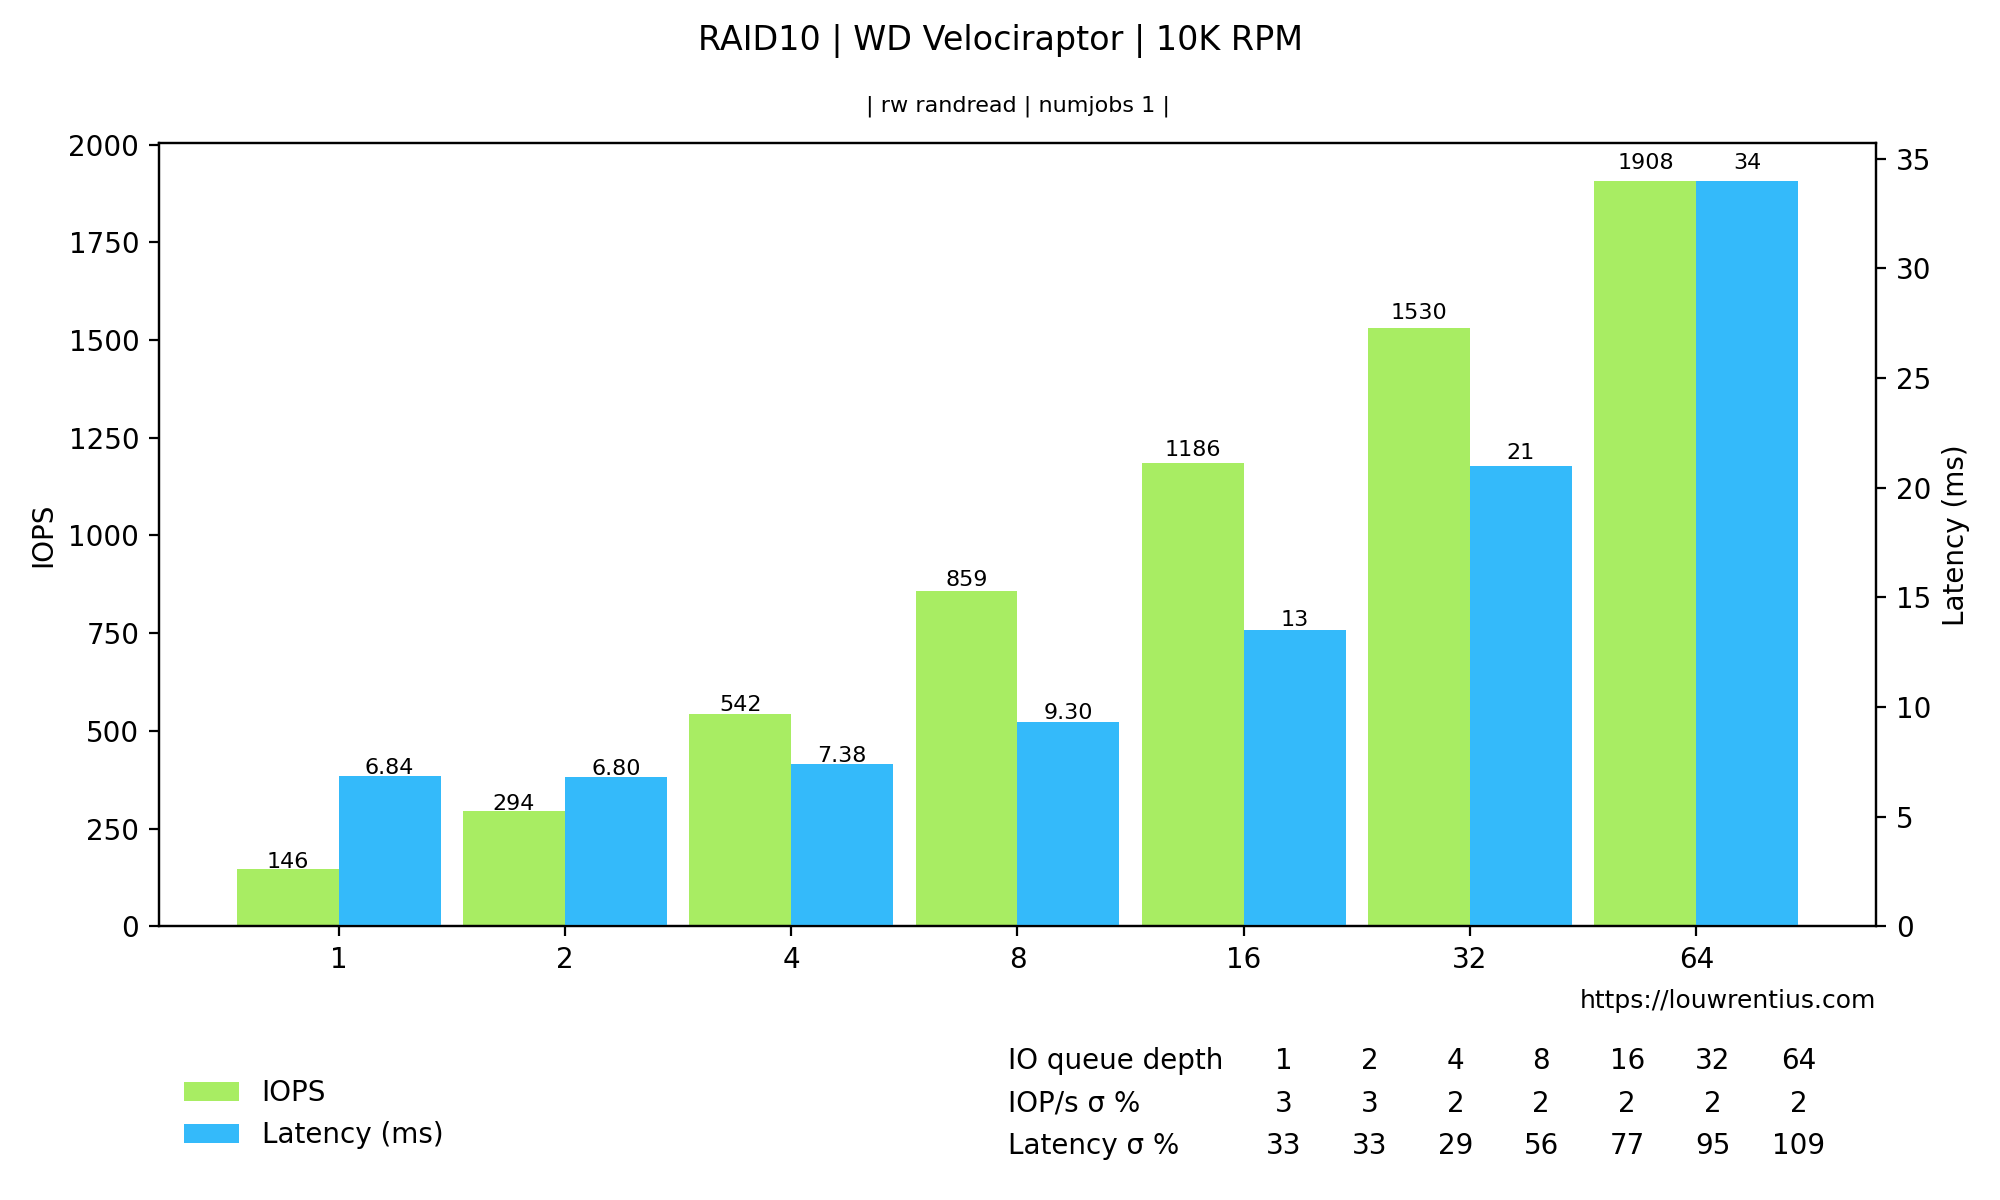
This kind of chart shows both IOPs and Latency for different queue depths.
This is the command-line used to generate this graph:
fio-plot -i INTEL_D3-S4610 --source "https://louwrentius.com" -T "INTEL D3-S4610 SSD on IBM M1015" -l -r randread
This kind of chart shows both IOPs and Latency for diffent simultaneous number of jobs.

This is the command-line used to generate this graph:
fio-plot -i INTEL_D3-S4610 --source "https://louwrentius.com" -T "INTEL D3-S4610 SSD on IBM M1015" -N -r randread
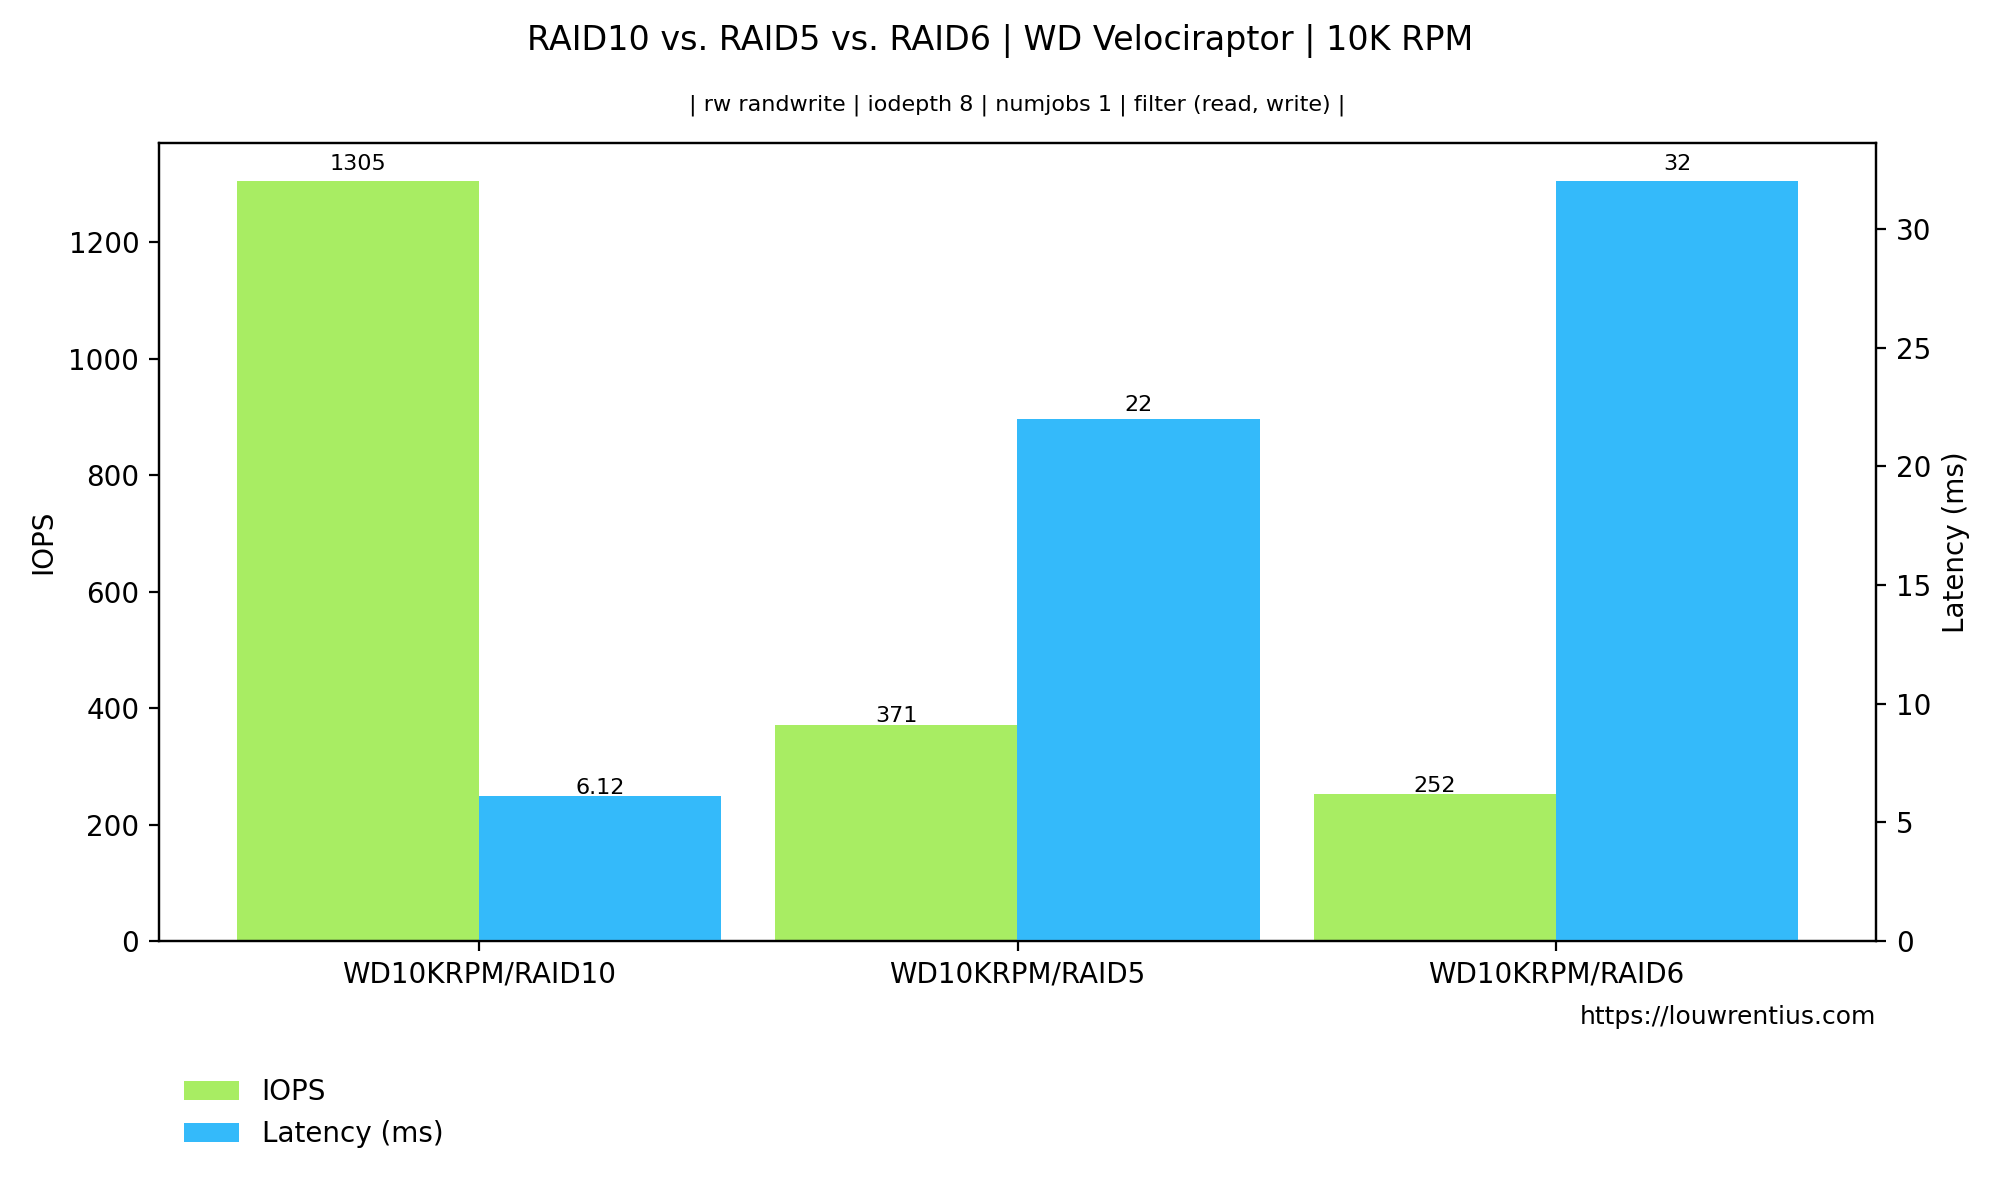
The compare chart shows the results from multiple different benchmarks in one graph. The graph data is always for a specific queue depth and numjobs values (the examples use qd=1, nj=1 (the default)).
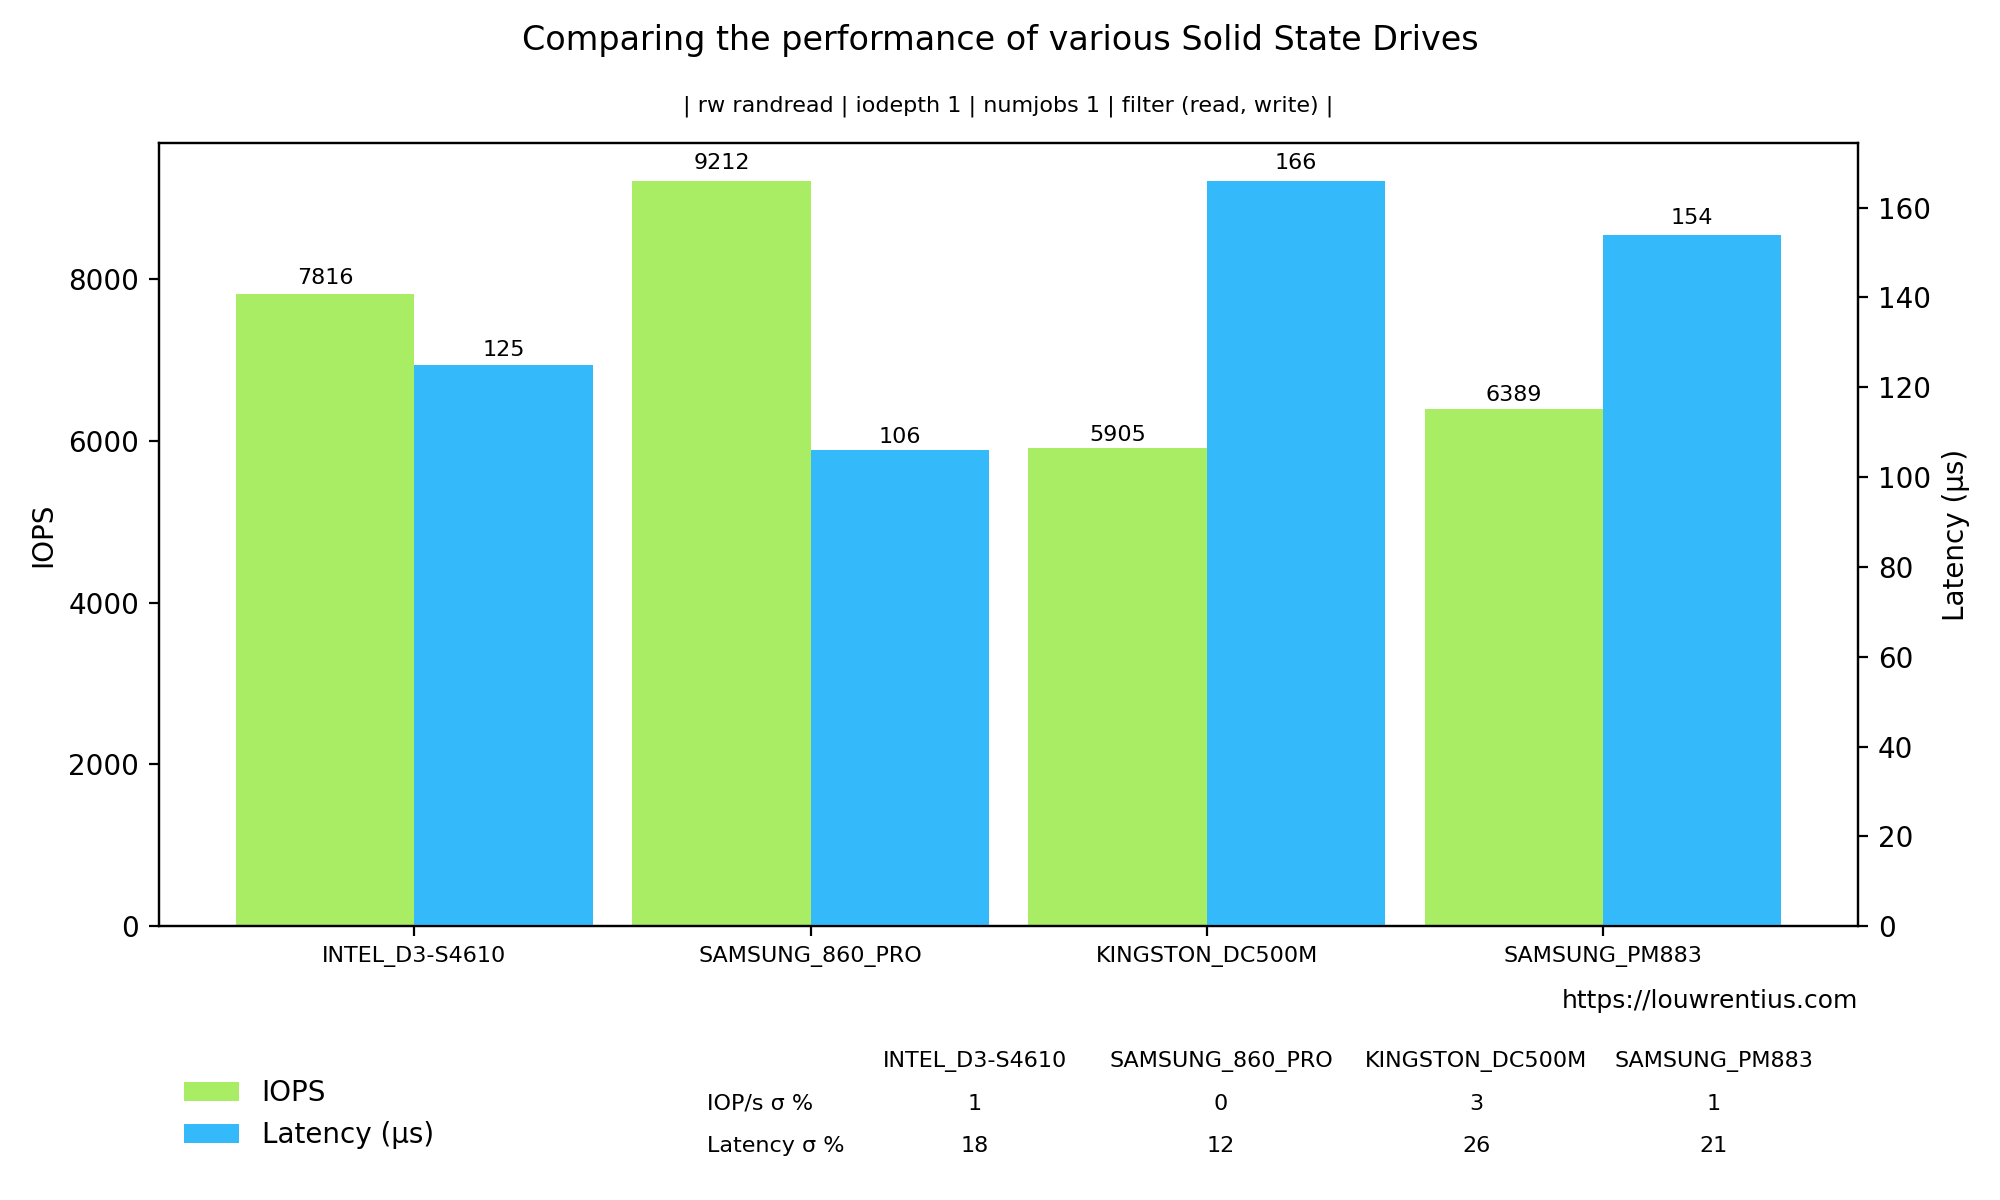
This is the command-line used to generate this graph:
fio-plot -i INTEL_D3-S4610 SAMSUNG_860_PRO KINGSTON_DC500M SAMSUNG_PM883 --source "https://louwrentius.com" -T "Comparing the performance of various Solid State Drives" -C -r randread --xlabel-parent 0
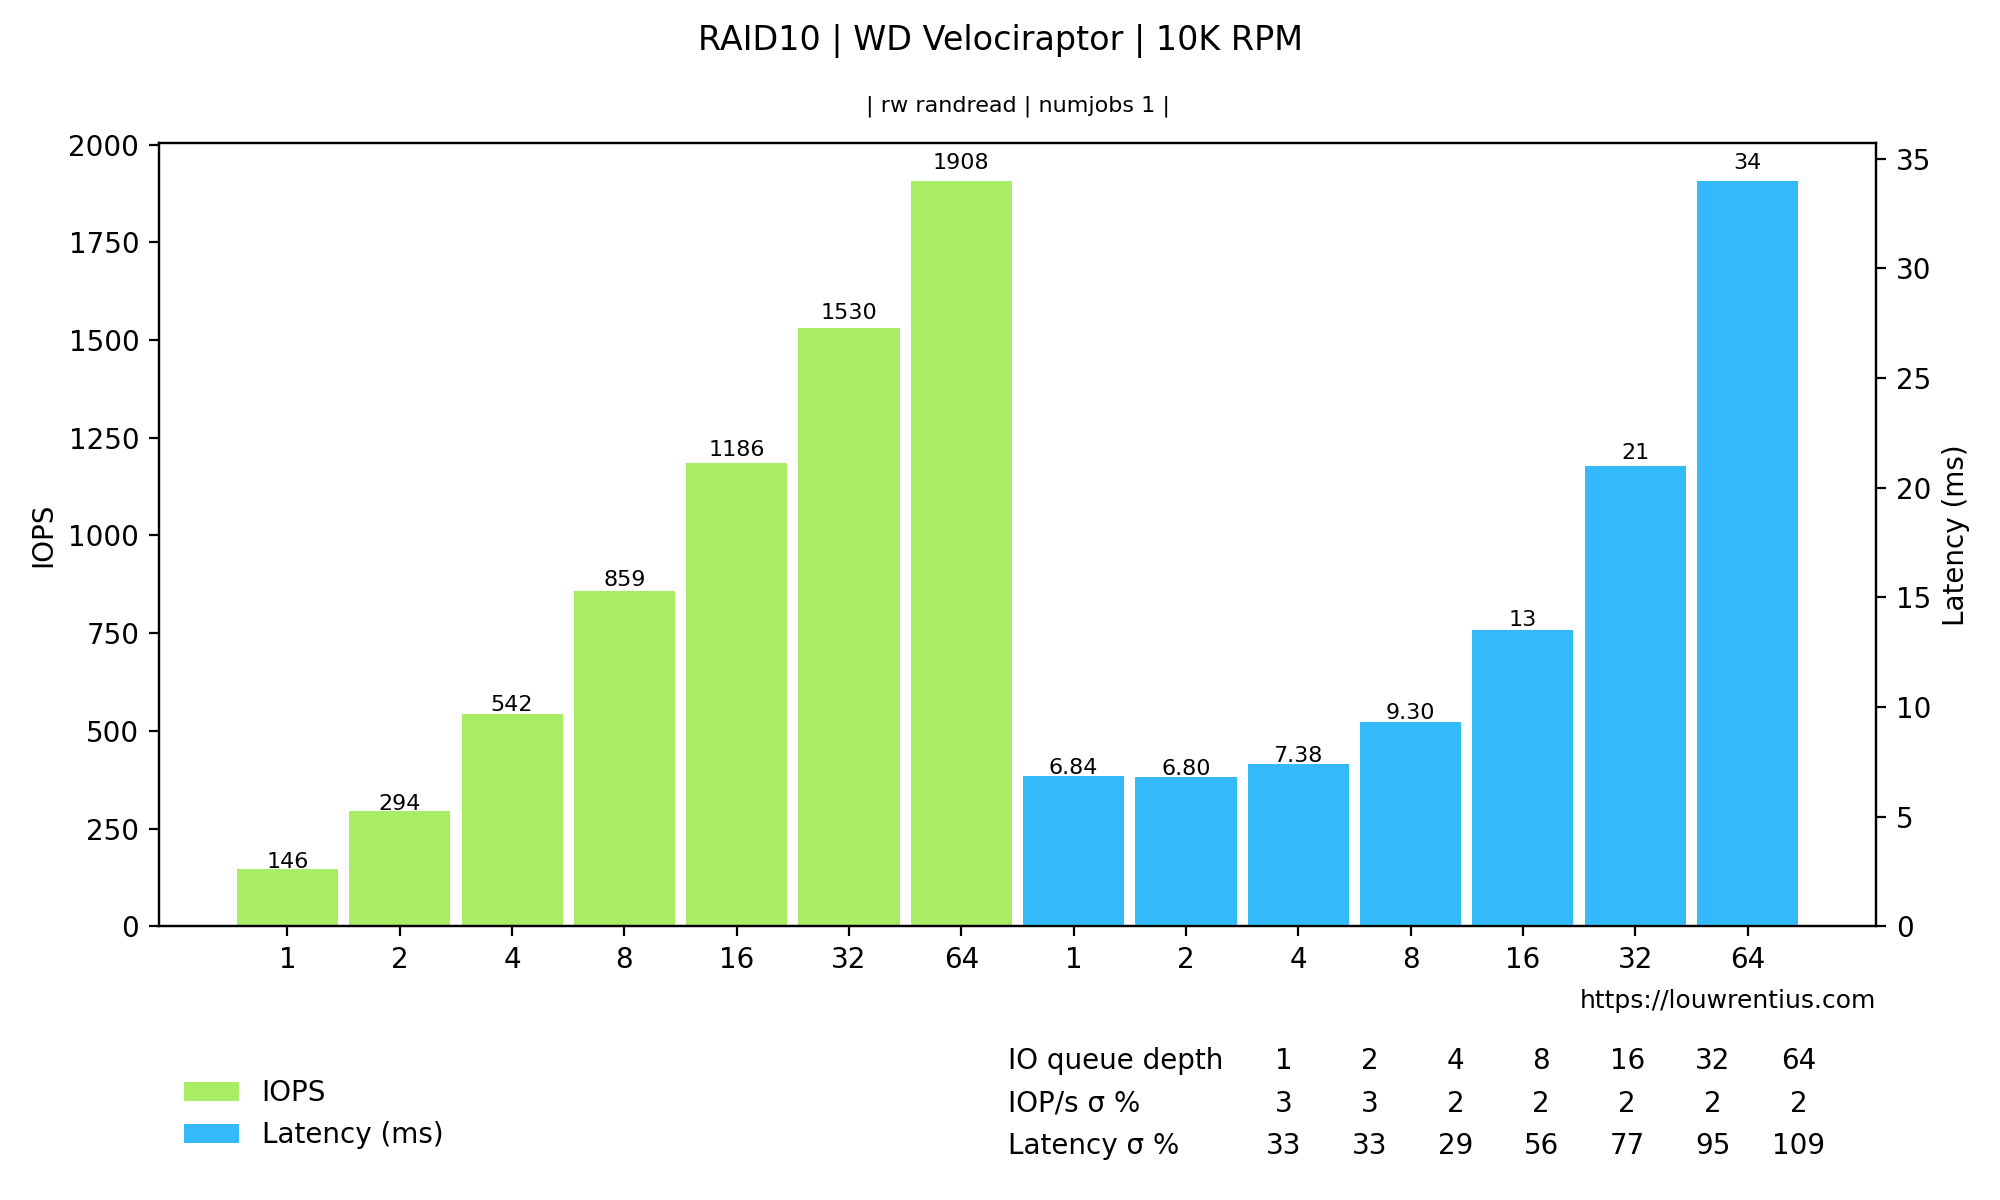
It is also possible to group the bars for IOPs and Latency like this:
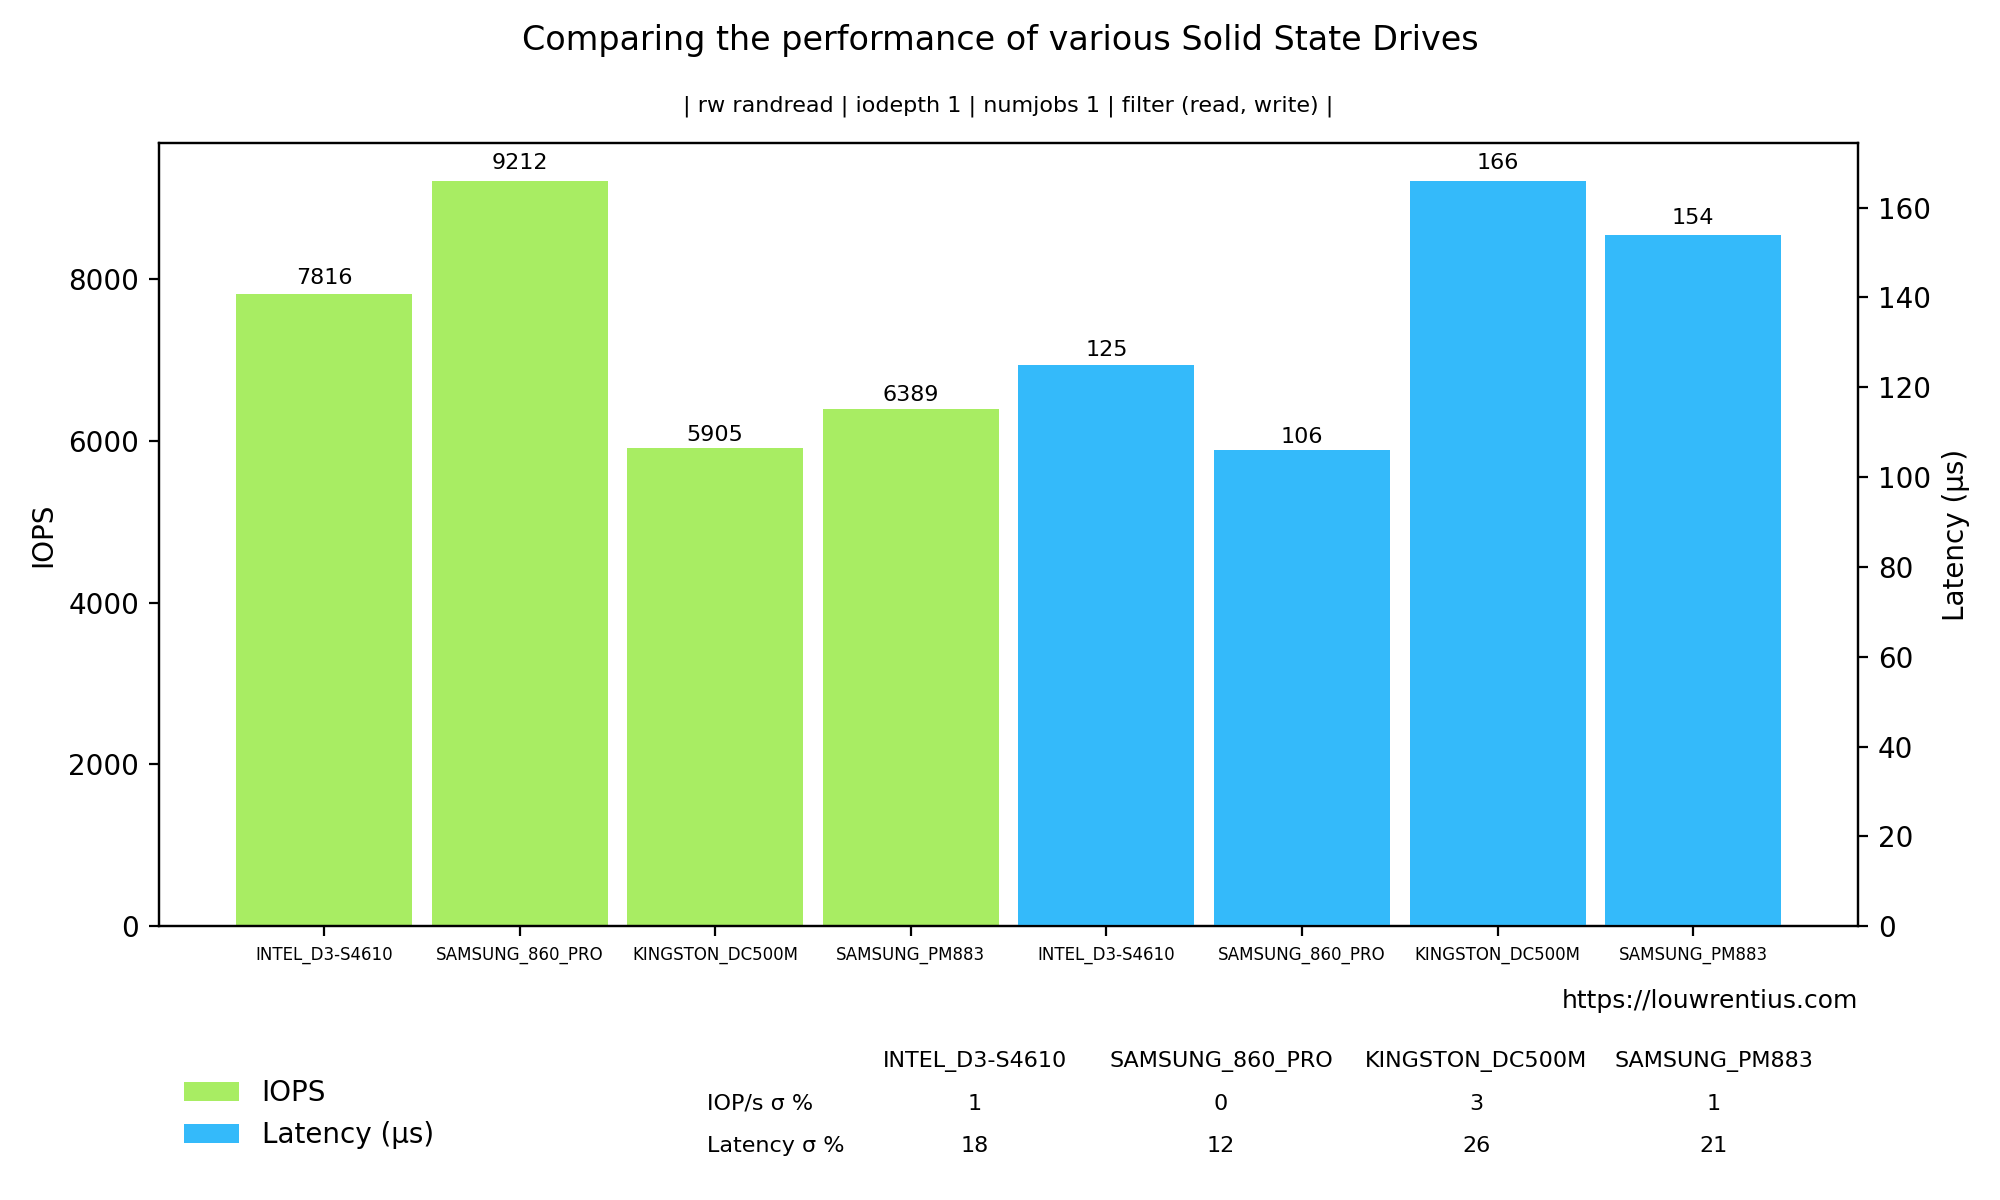
This is the command-line used to generate this graph:
fio-plot -i INTEL_D3-S4610 SAMSUNG_860_PRO KINGSTON_DC500M SAMSUNG_PM883 --source "https://louwrentius.com" -T "Comparing the performance of various Solid State Drives" -C -r randread --xlabel-parent 0 --group-bars
A 3D bar chart that plots both queue depth an numjobs against either latency or IOPs. This example shows IOPs.
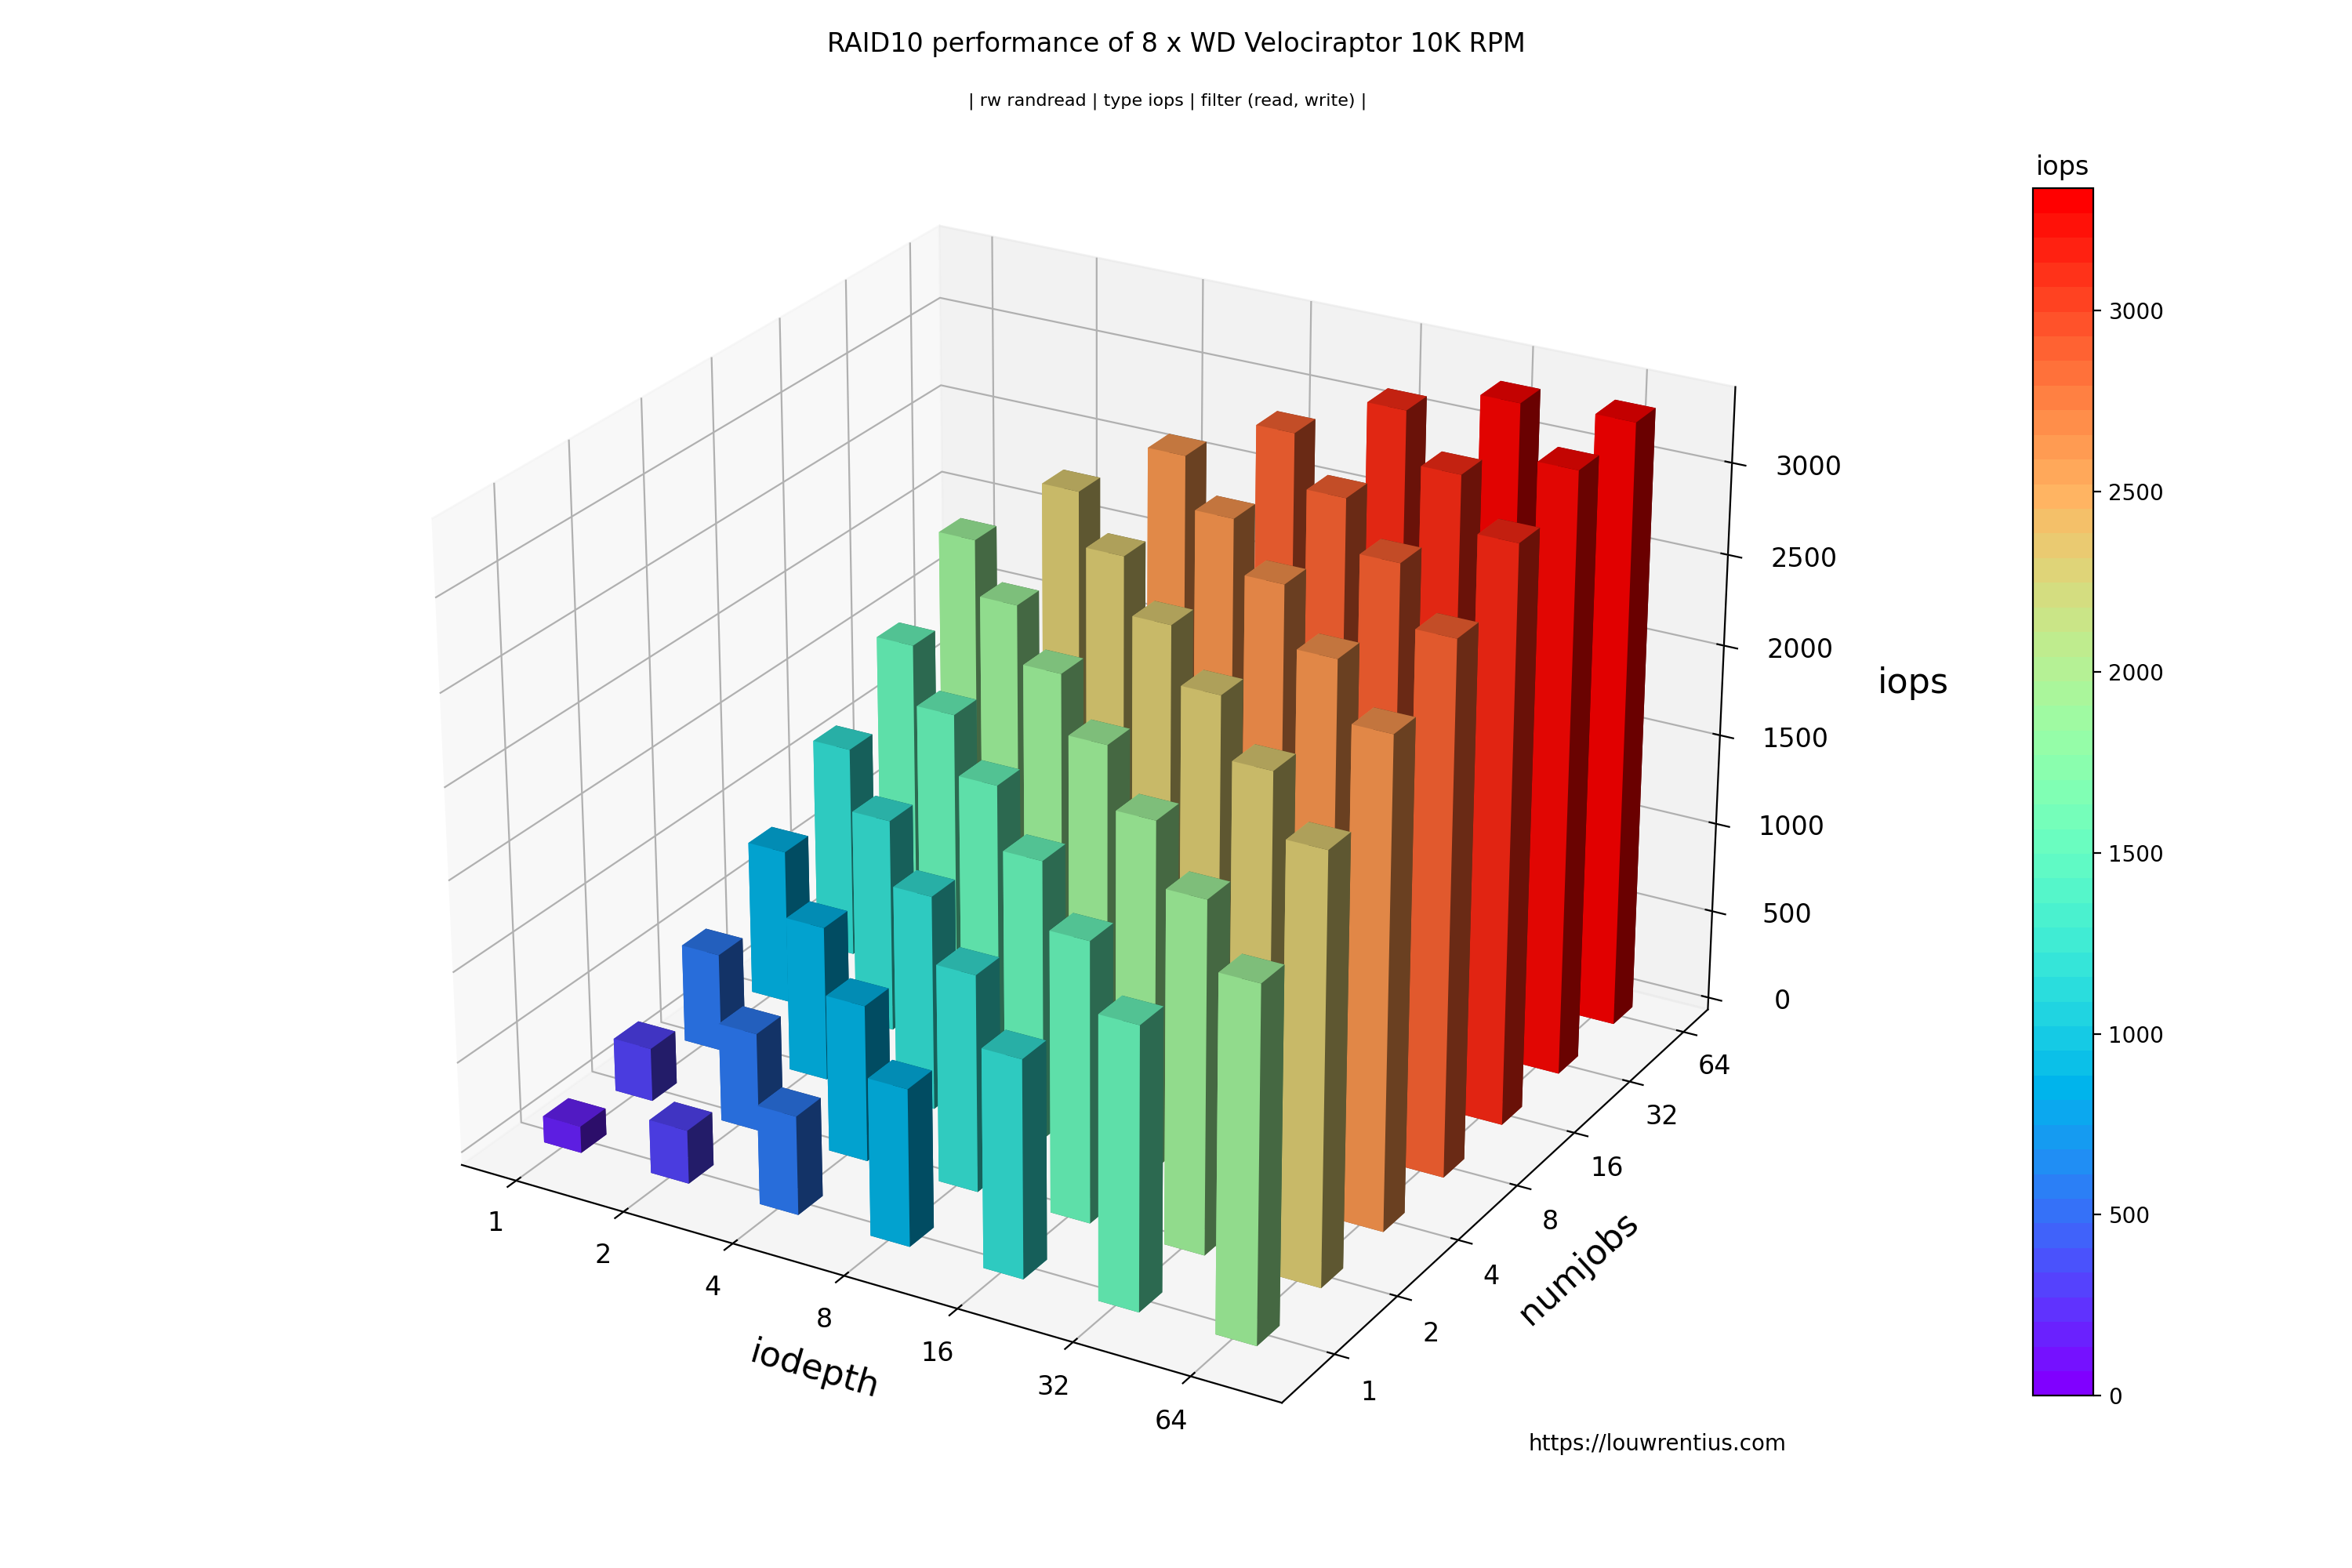
This is the command-line used to generate this graph:
fio-plot -i RAID10 --source "https://louwrentius.com" -T "RAID10 performance of 8 x WD Velociraptor 10K RPM" -L -t iops -r randread
It is also possible to chart the latency:
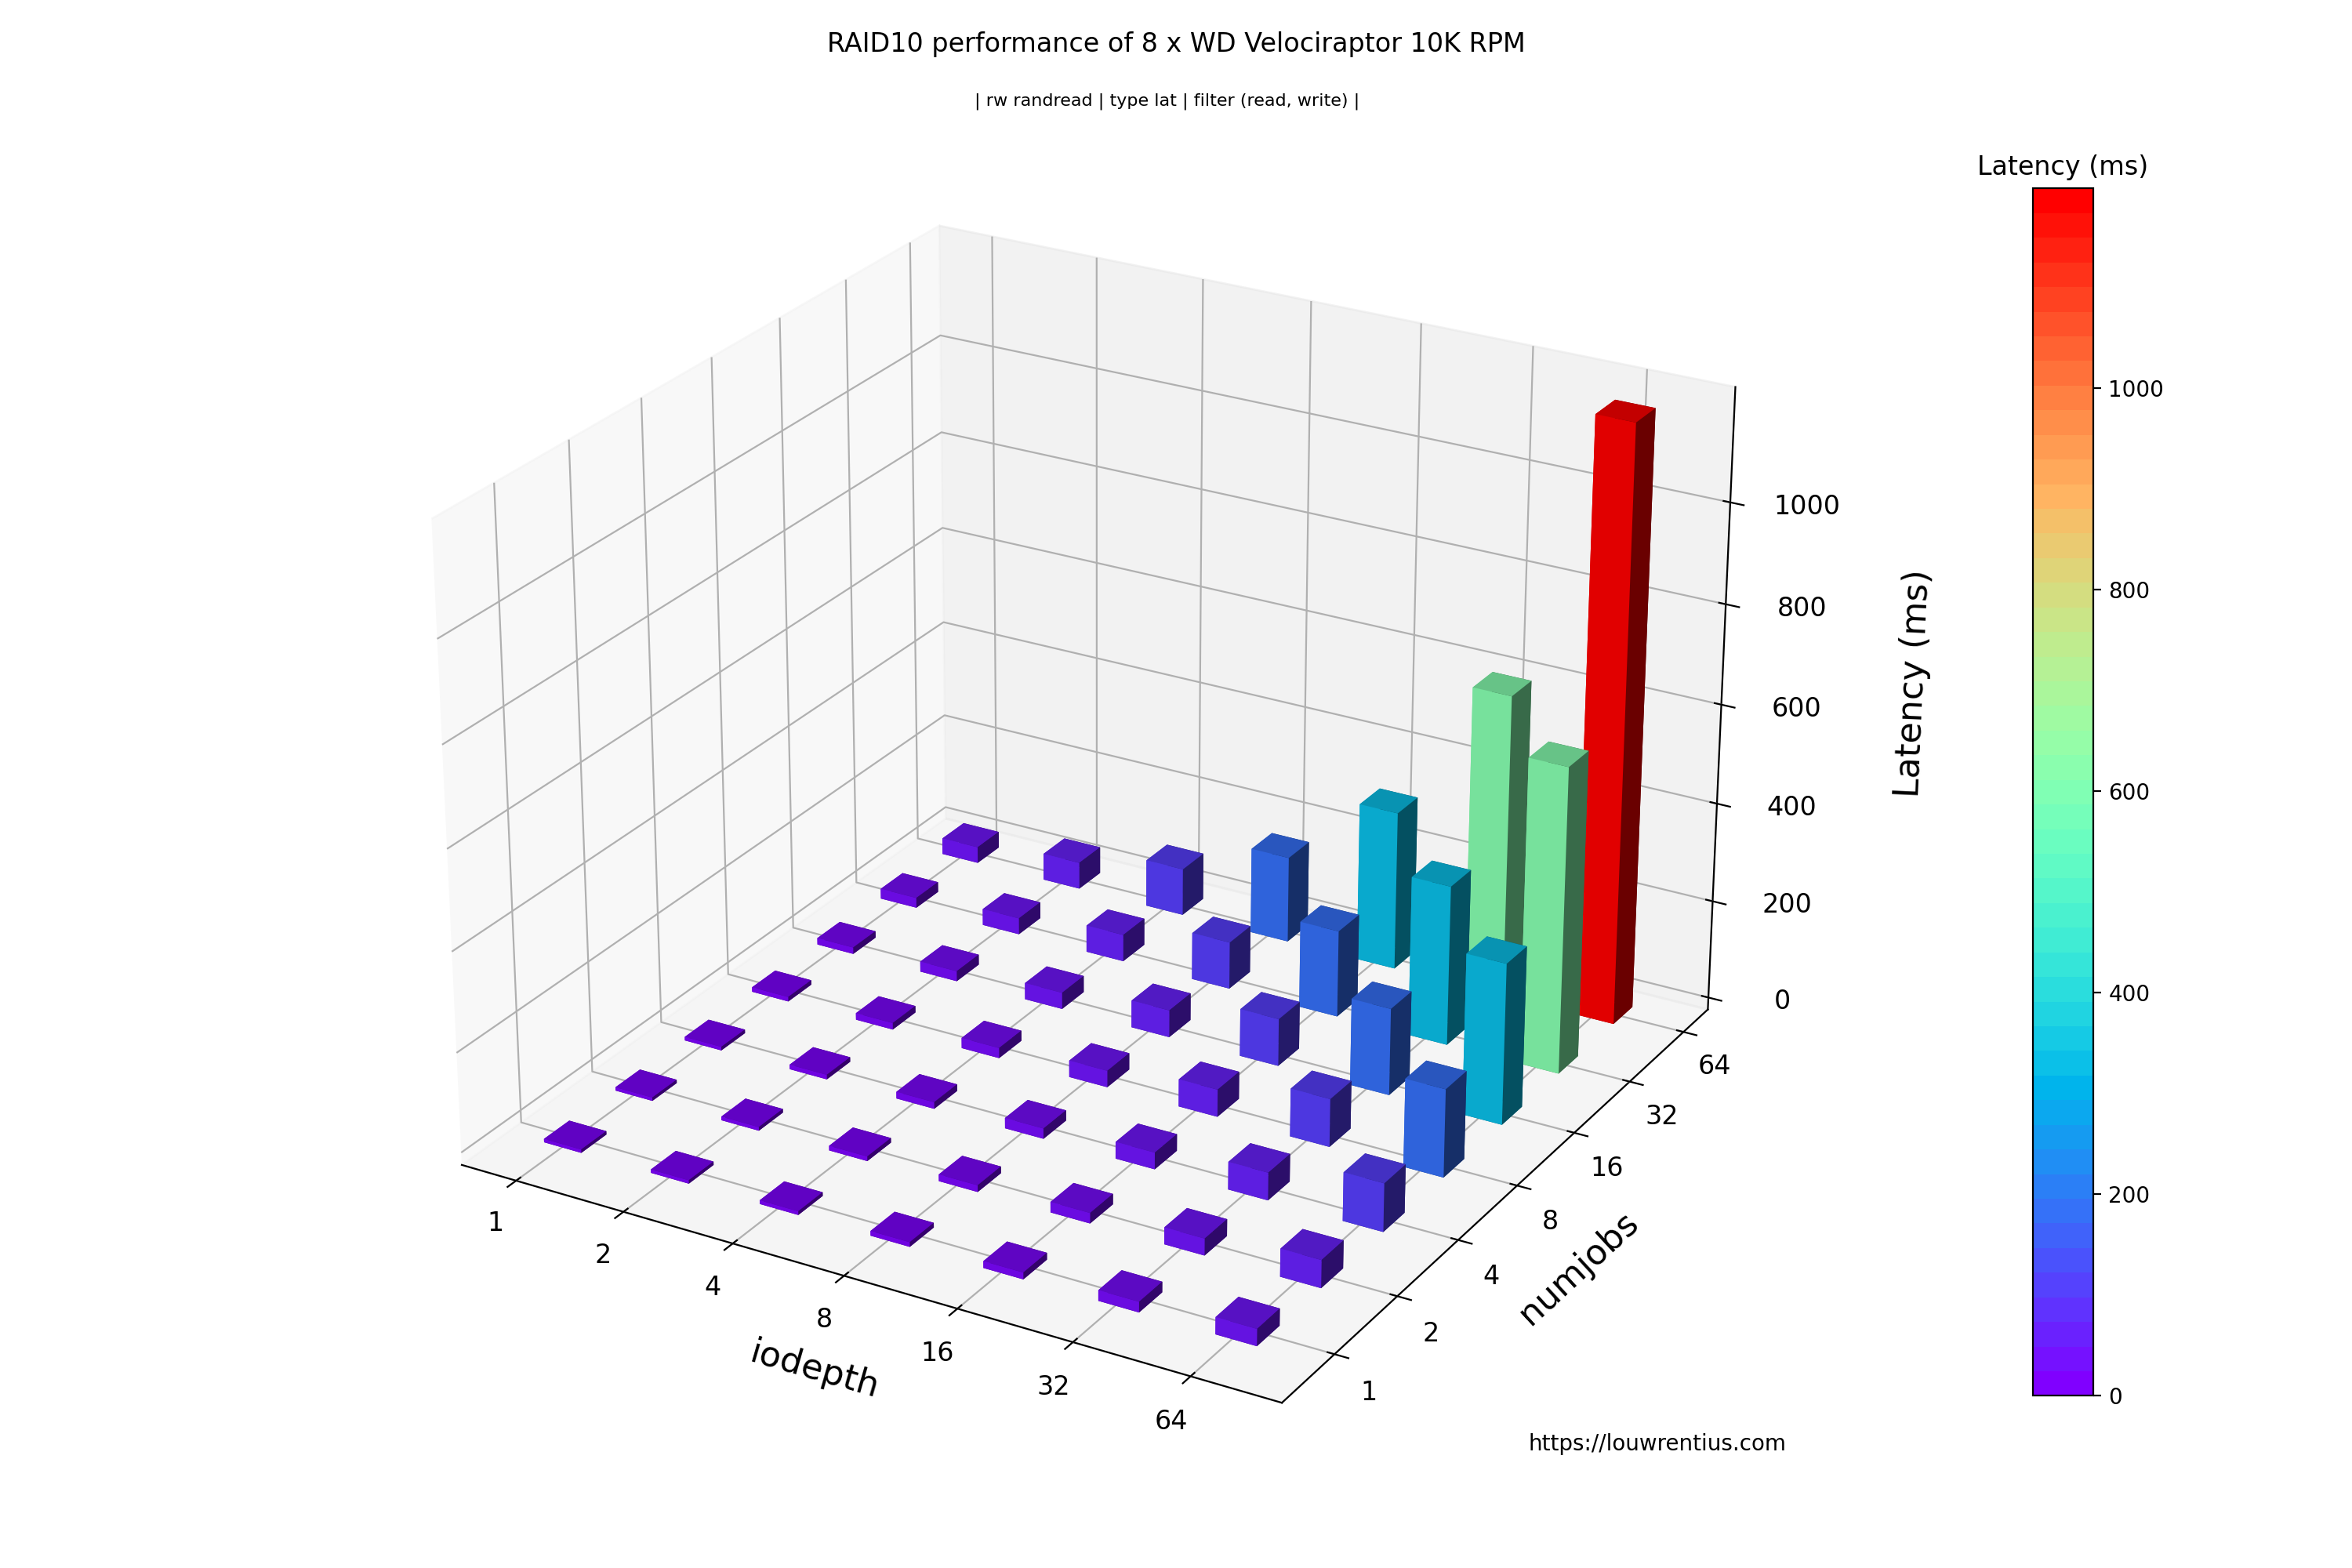
This is the command-line used to generate this graph:
fio-plot -i RAID10 --source "https://louwrentius.com" -T "RAID10 performance of 8 x WD Velociraptor 10K RPM" -L -t lat -r randread
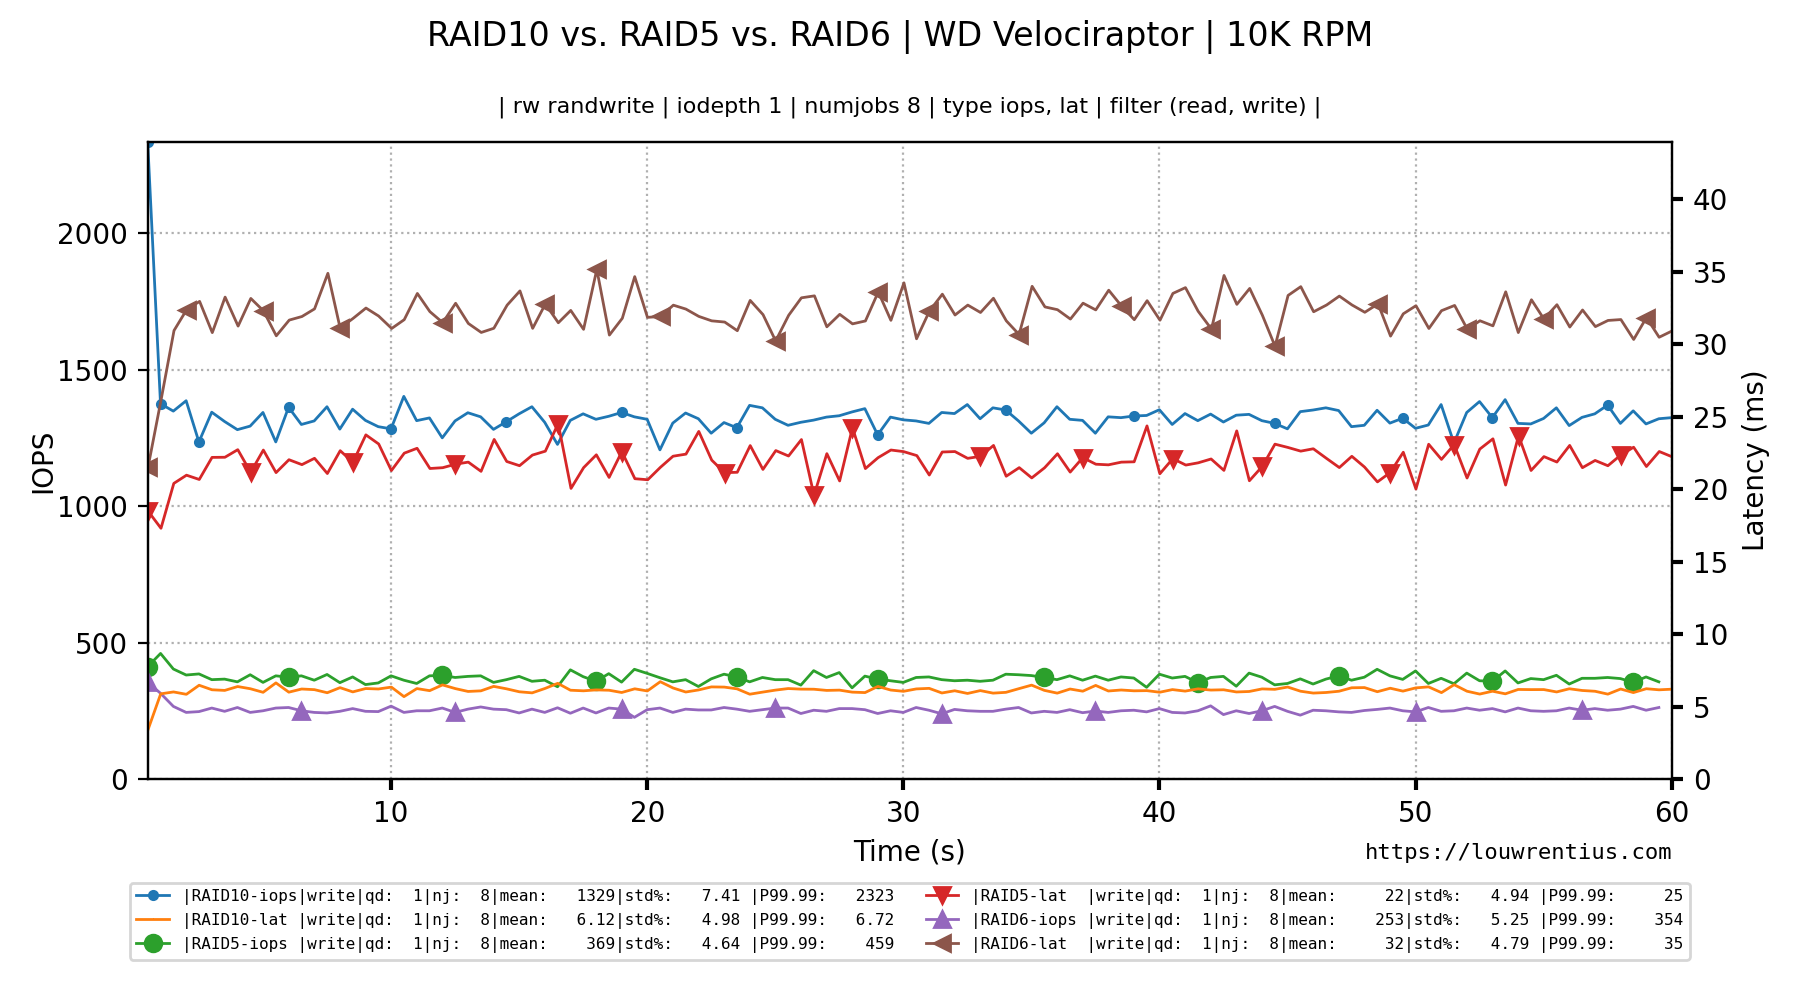
Fio records a 'performance trace' of various metrics, such as IOPs and latency over time in plain-text .log files. If you use the benchmark tool included with fio-plot, this data is logged every 1 second.
This data can be parsed and graphed over time. In this example, we plot the data for four different solid state drives in one chart.
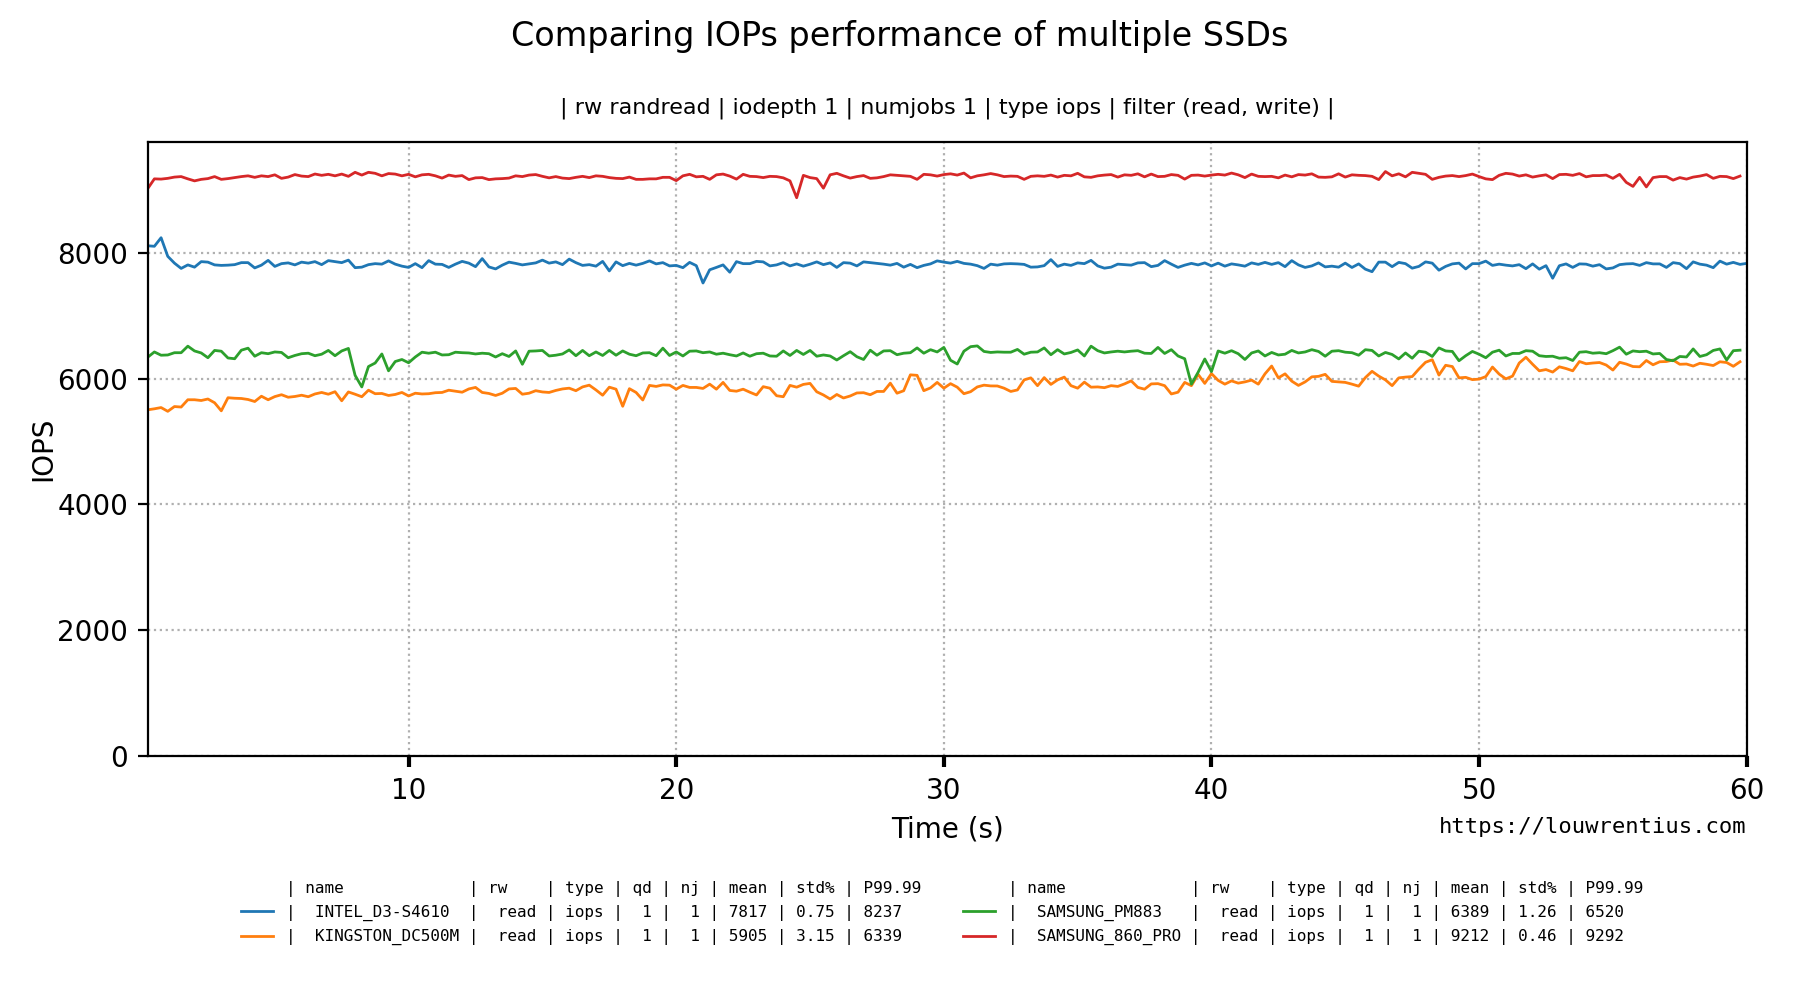
This is the command-line used to generate this graph:
fio-plot -i INTEL_D3-S4610/ KINGSTON_DC500M/ SAMSUNG_PM883/ SAMSUNG_860_PRO/ --source "https://louwrentius.com" -T "Comparing IOPs performance of multiple SSDs" -g -t iops -r randread --xlabel-parent 0
It is also possible to chart the latency instead of IOPs.
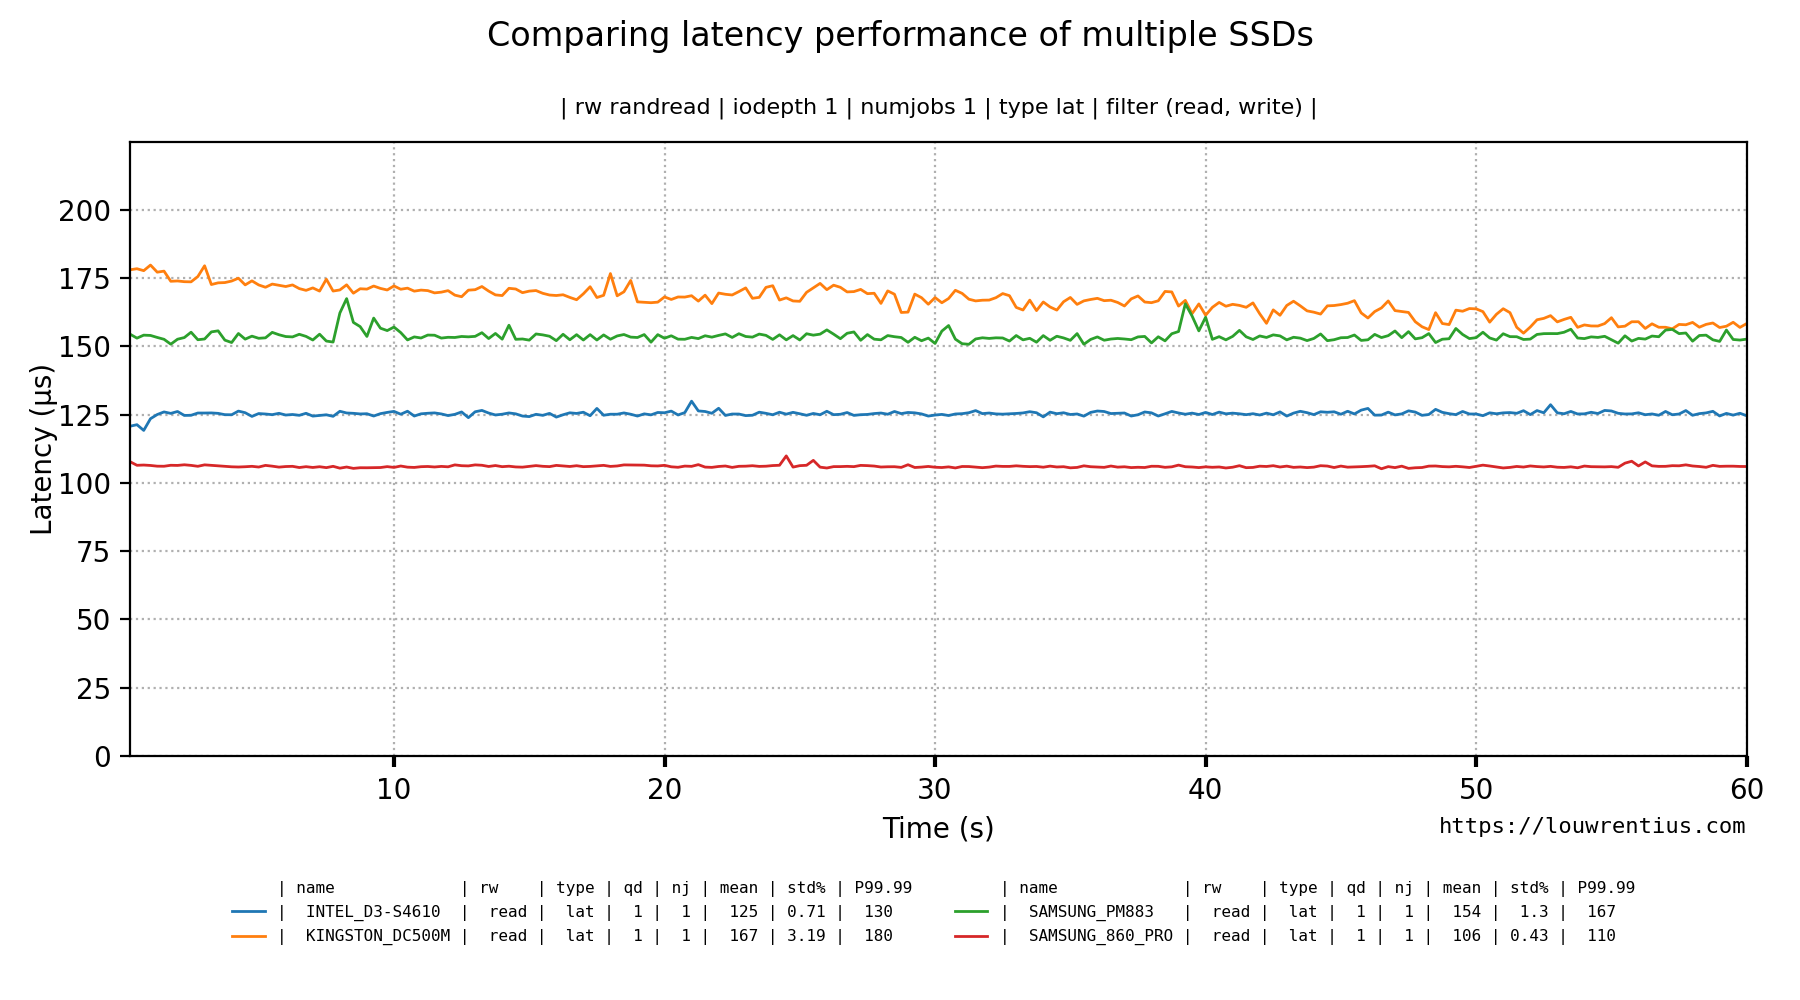
This is the command-line used to generate this graph:
fio-plot -i INTEL_D3-S4610/ KINGSTON_DC500M/ SAMSUNG_PM883/ SAMSUNG_860_PRO/ --source "https://louwrentius.com" -T "Comparing latency performance of multiple SSDs" -g -t lat -r randread --xlabel-parent 0
You can also include all information in one graph:
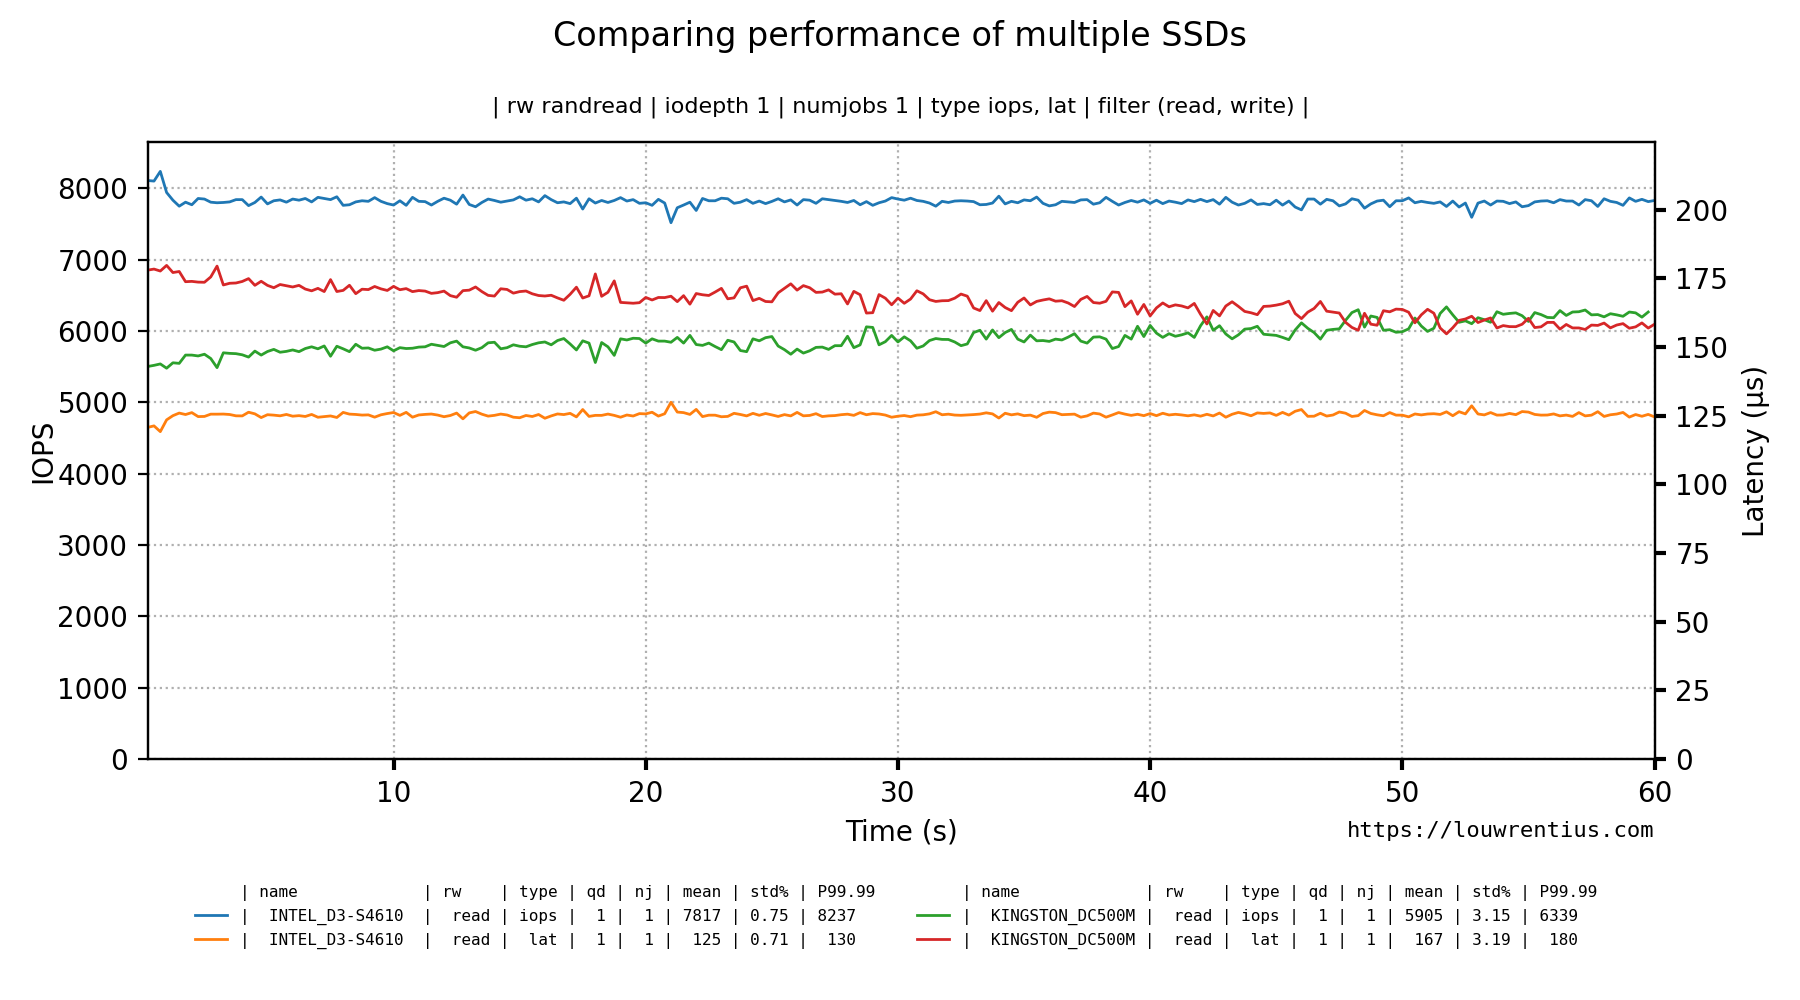
This is the command-line used to generate this graph:
fio-plot -i INTEL_D3-S4610/ KINGSTON_DC500M/ --source "https://louwrentius.com" -T "Comparing performance of multiple SSDs" -g -t iops lat -r randread --xlabel-parent 0
And this is an example with a single benchmark run, comparing the performance of multiple queue depths.
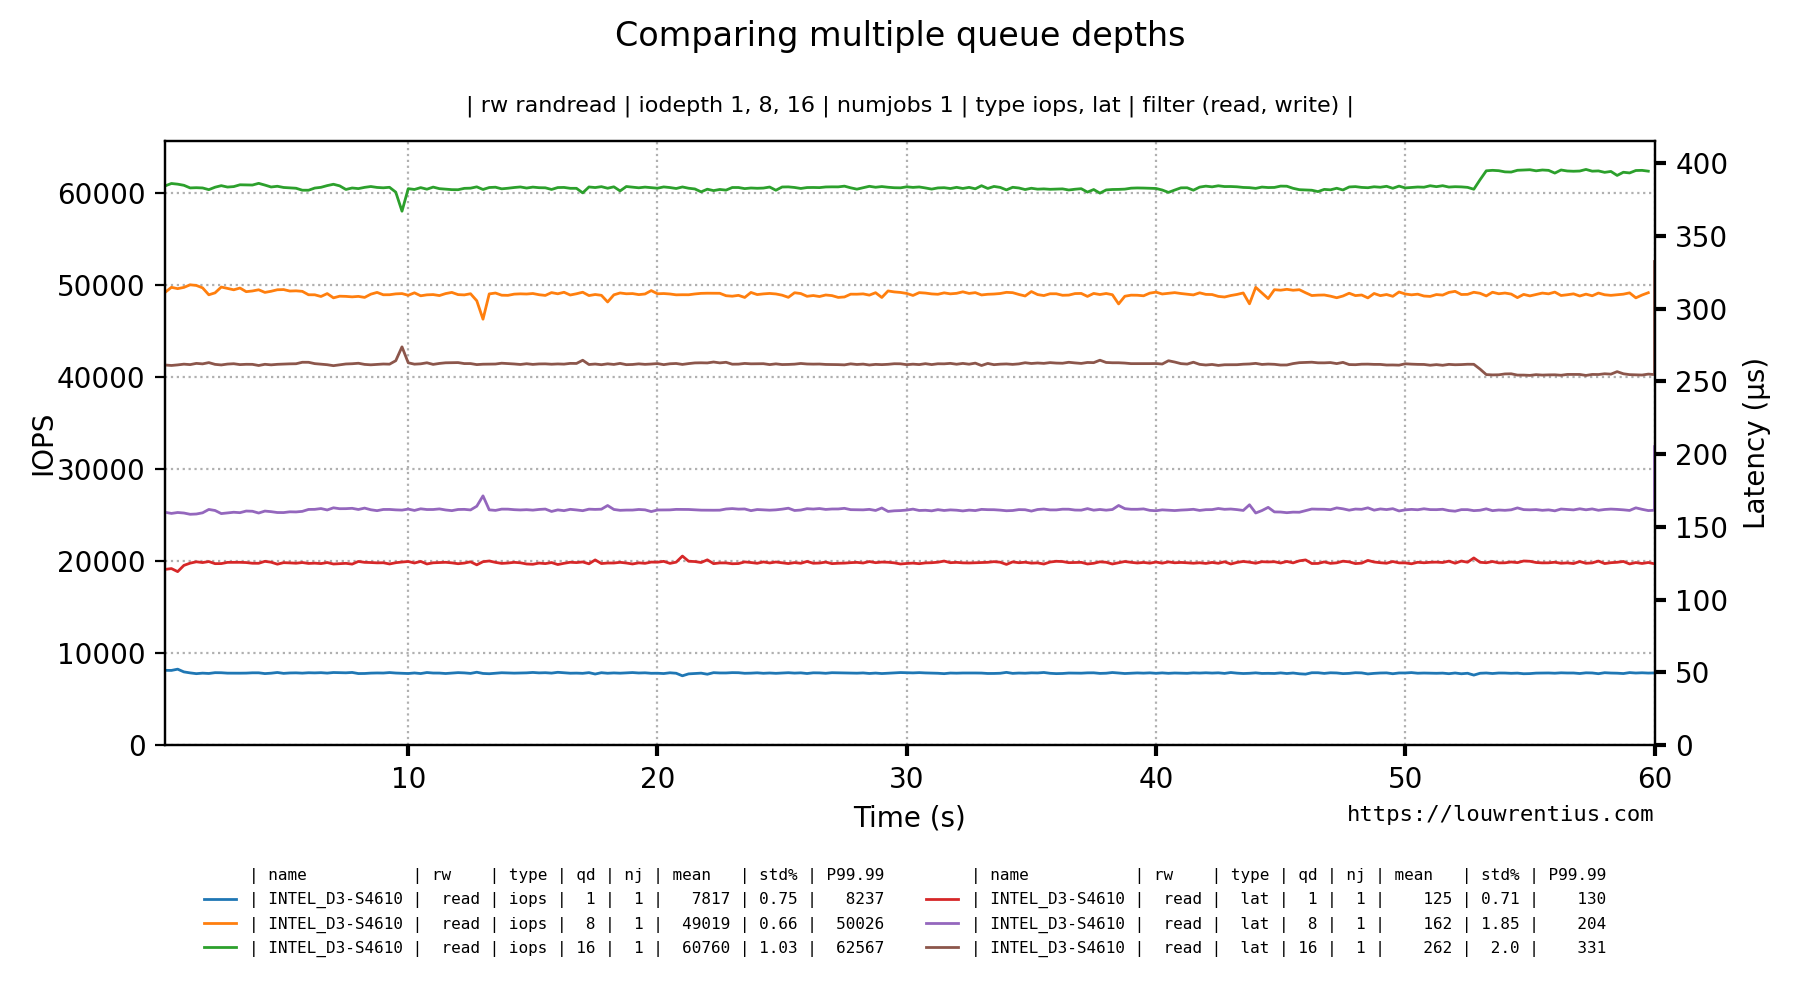
This is the command-line used to generate this graph:
fio-plot -i INTEL_D3-S4610 --source "https://louwrentius.com" -T "Comparing multiple queue depths" -g -t iops lat -r randread -d 1 8 16 --xlabel-parent 0
It is also possible to chart a total of the read+write data (iops/bw/lat) with the --draw-total option. This only works for -g style graphs and it requires a 'randrw' benchmark that is not 100% read, it should contain write data.

This is the command-line used to generate this graph:
fio-plot -i . -T "TEST" -r randrw -g -t iops --draw-total
The FIO JSON output also contains latency histogram data. It's available in a ns, us and ms scale.
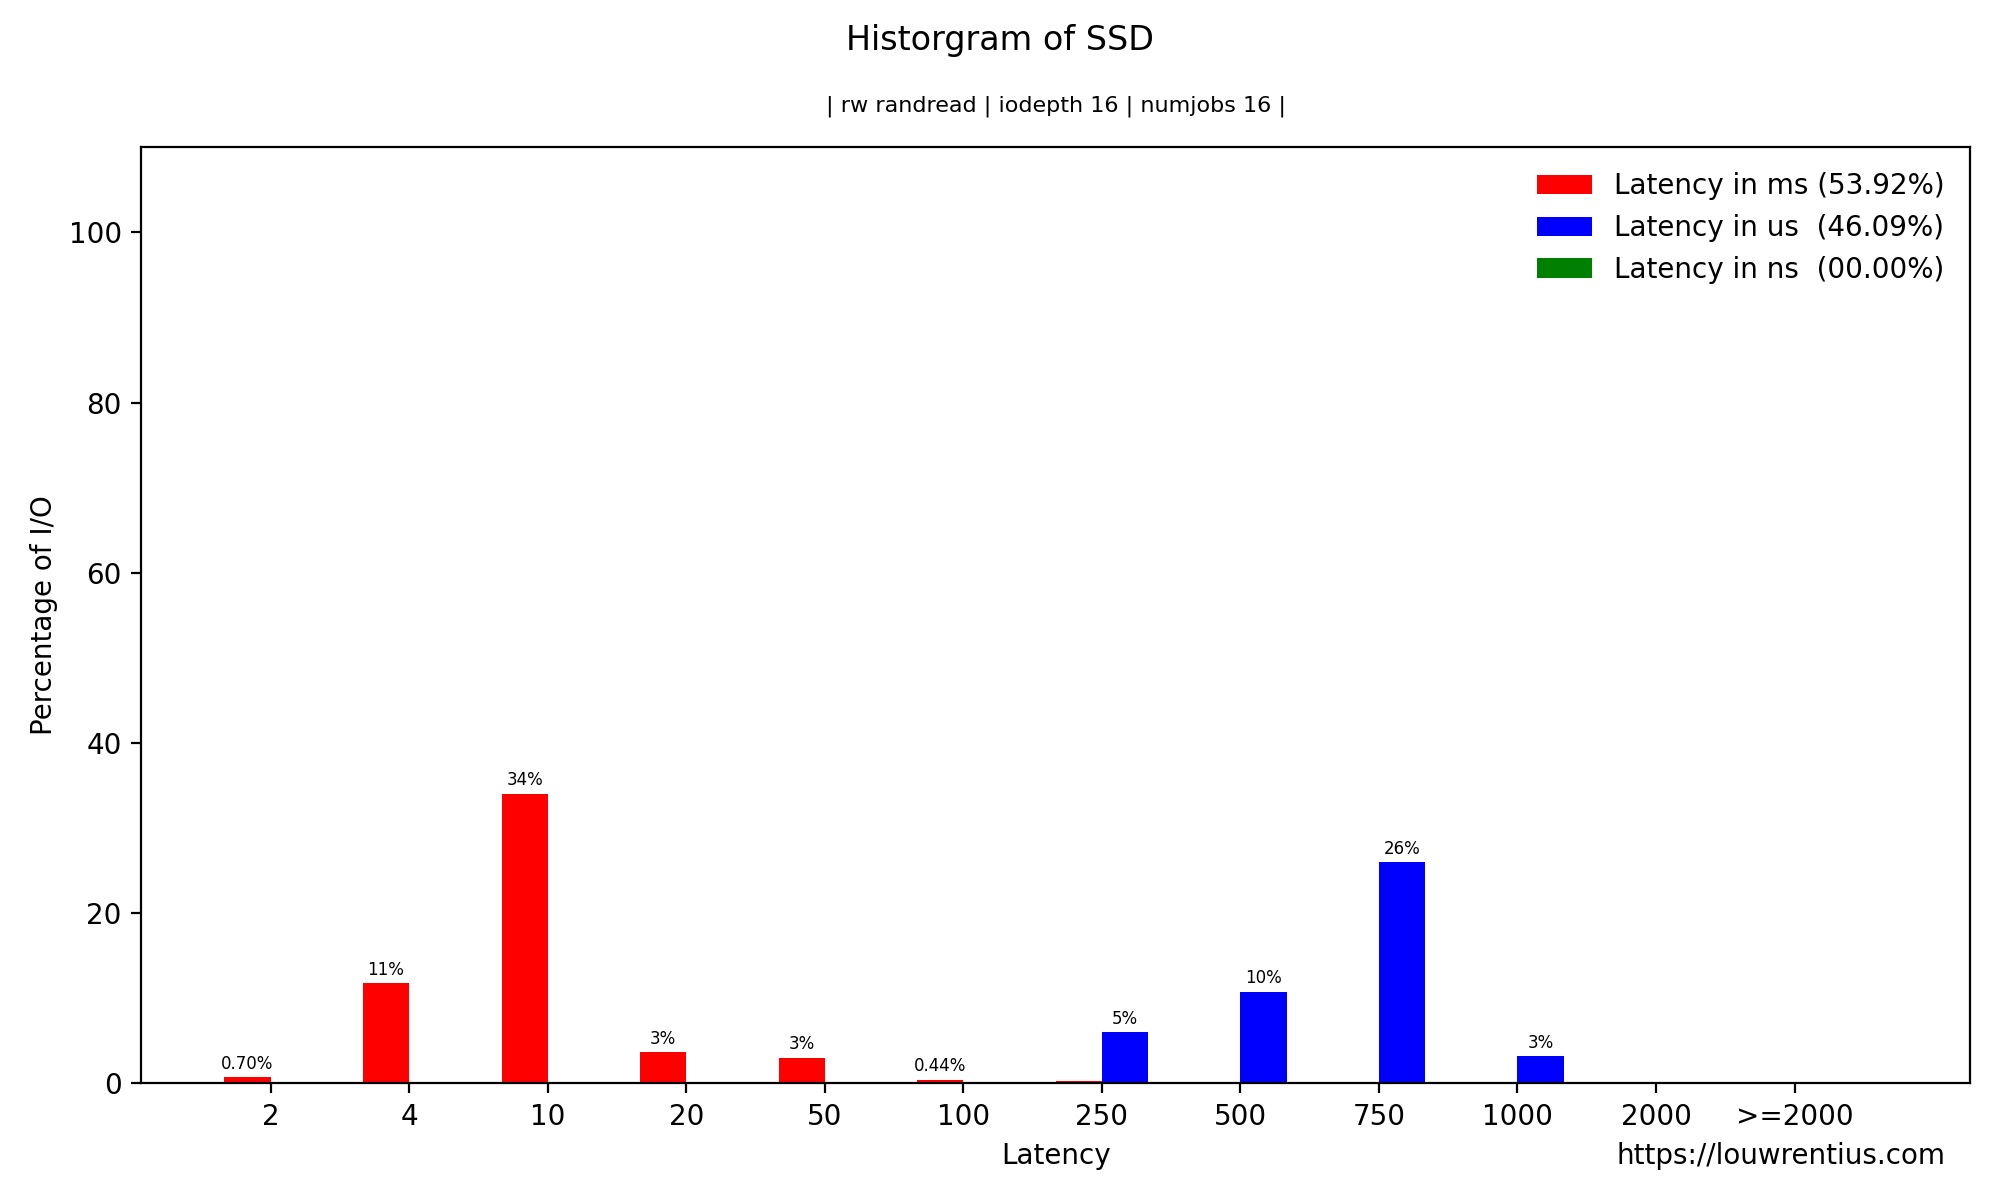
This is the command-line used to generate this graph:
fio-plot -i SAMSUNG_860_PRO/ --source "https://louwrentius.com" -T "Historgram of SSD" -H -r randread -d 16 -n 16
Fio supports a client-server model where one fio client can run a benchmark on multiple machines (servers) in parallel. The bench-fio tool supports this type of benchmark, see the readme for more details. For the fio-plot tool the data will be rendered based on hostname automatically.
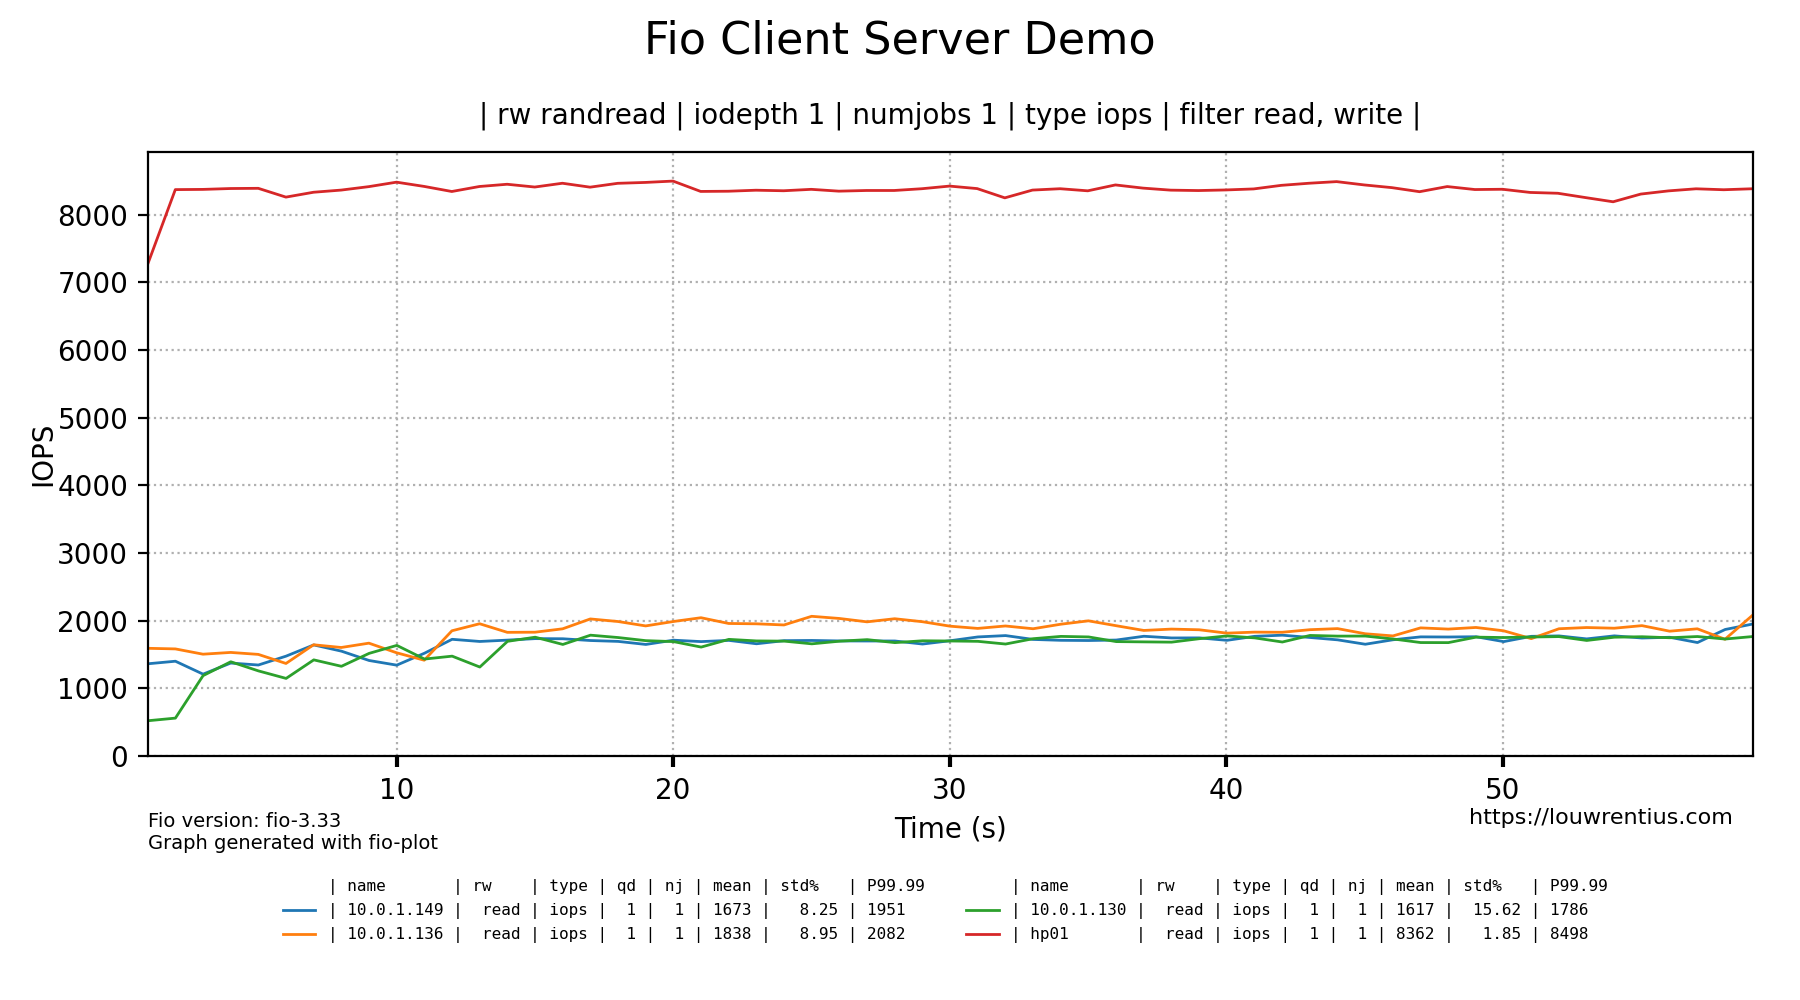
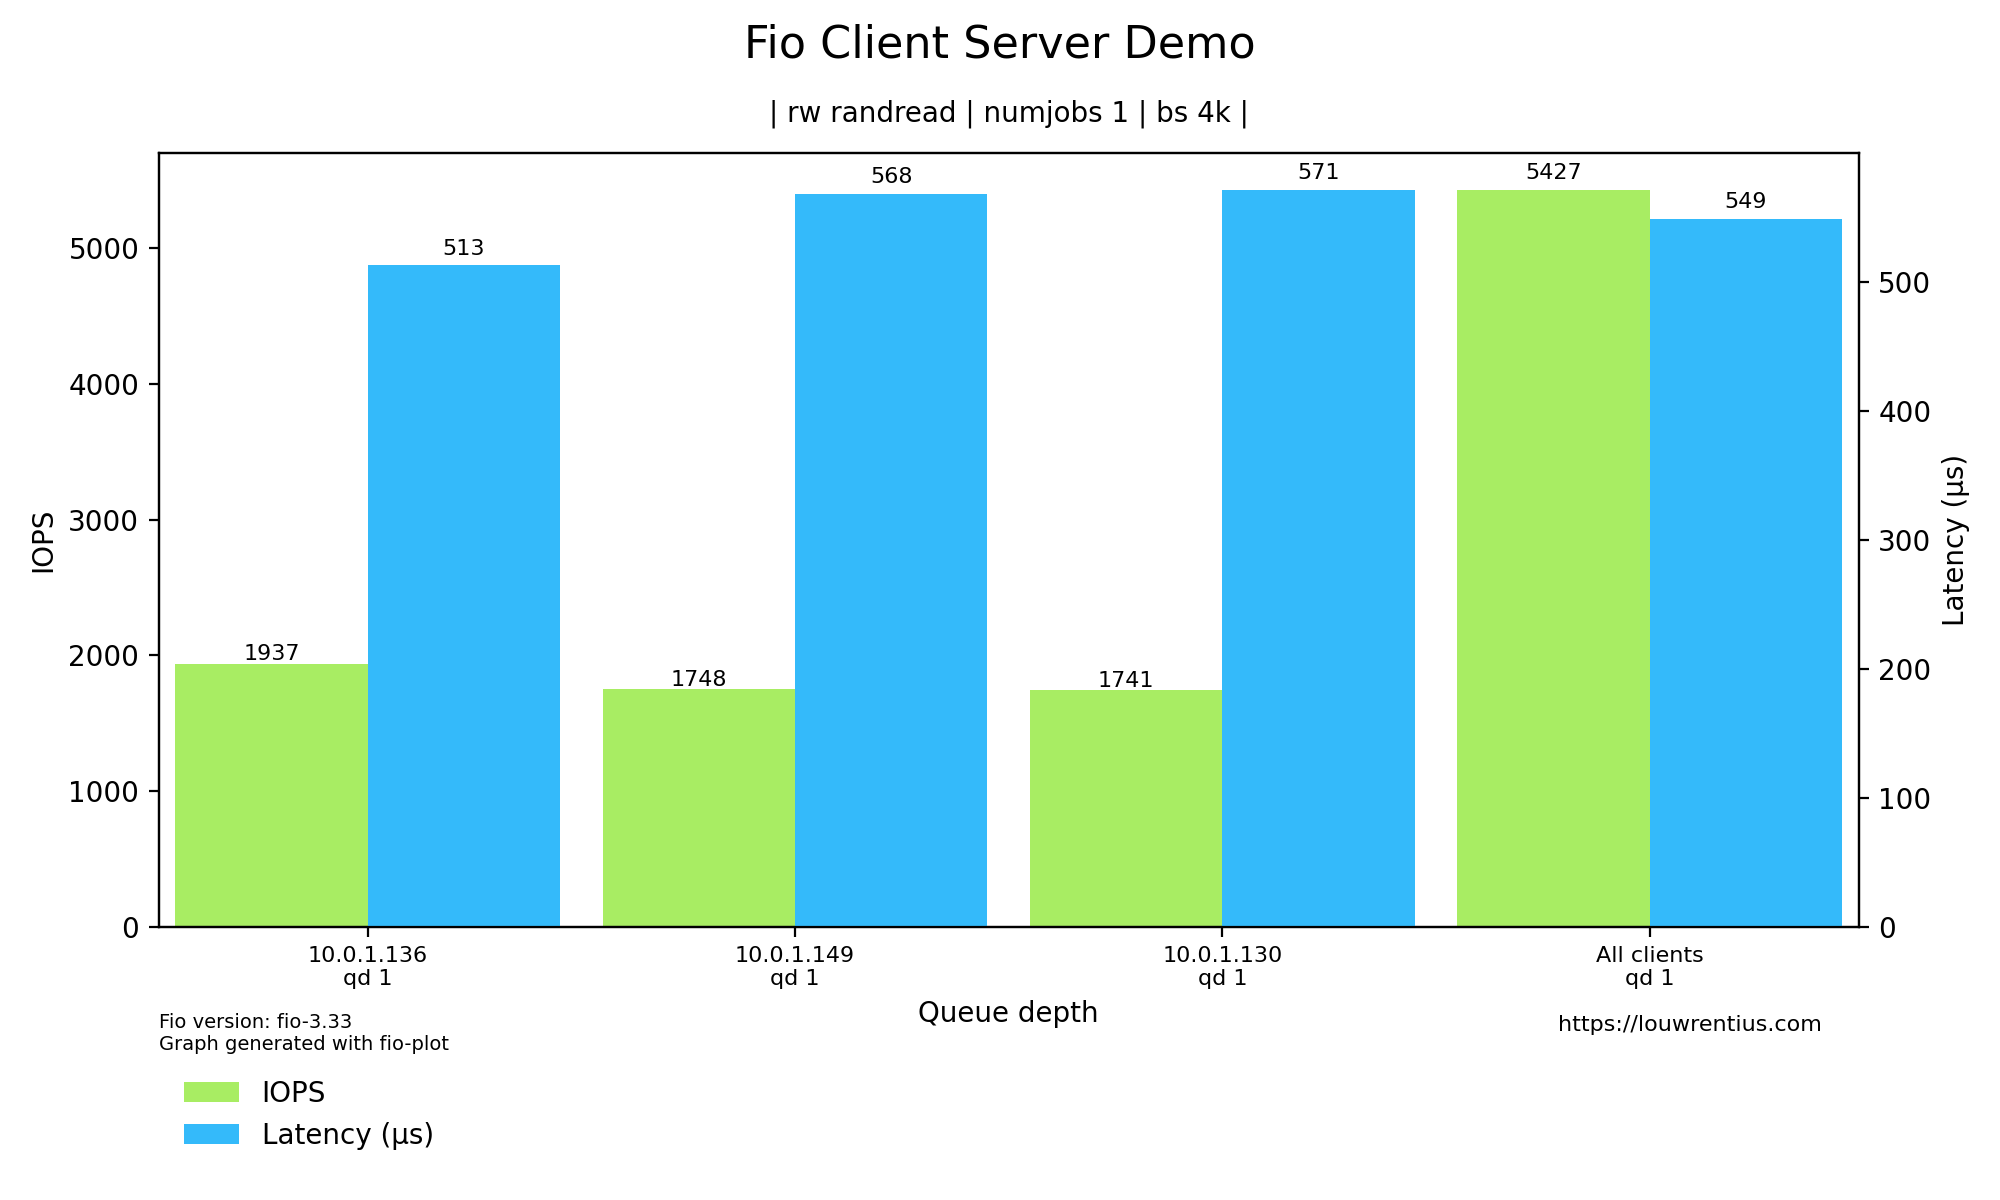
The --include-hosts and --exclude-hosts parameters allow filtering to only display the desired hosts.
A benchmark script is provided alongside fio-plot, that automates the process of running multiple benchmarks with different parameters. For example, it allows you to gather data for different queue depths and/or number of simultaneous jobs. The benchmark script shows progress in real-time.
████████████████████████████████████████████████████
		+++ Fio Benchmark Script +++

Job template:                  fio-job-template.fio
I/O Engine:                    libaio
Number of benchmarks:          98
Estimated duration:            1:38:00
Devices to be tested:          /dev/md0
Test mode (read/write):        randrw
IOdepth to be tested:          1 2 4 8 16 32 64
NumJobs to be tested:          1 2 4 8 16 32 64
Blocksize(s) to be tested:     4k
Mixed workload (% Read):       75 90

████████████████████████████████████████████████████
4% |█                        | - [0:04:02, 1:35:00]-]
This particular example benchmark was run with these parameters:
bench-fio --target /dev/md0 --type device --template fio-job-template.fio --mode randrw --output RAID_ARRAY --readmix 75 90 --destructive
In this example, we run a mixed random read/write benchmark. We have two runs, one with a 75% / 25% read/write mix and one with a 90% / 10% mix.
You can run the benchmark against an entire device or a file/folder. Alongside the benchmark script, a Fio job template file is supplied (fio-job-template.fio). This file can be customised as desired.
For more examples, please consult the separate README.md
Fio-plot requires 'matplotlib' and 'numpy' to be installed.
Please note that Fio-plot requires at least matplotlib version 3.3.0
Fio-plot also writes metadata to the PNG files using Pillow
Creating a 2D Bar Chart based on randread data and numjobs = 1 (default).
fio-plot -i <benchmark_data_folder> -T "Title" -s https://louwrentius.com -l -r randread
Creating a 2D Bar Chart based on randread data and numjobs = 8.
fio-plot -i <benchmark_data_folder> -T "Title" -s https://louwrentius.com -l -n 8 -r randread
Creating a 2D Bar Chart grouping iops and latency data together:
fio-plot -i <benchmark_data_folder> -T "Title" -s https://louwrentius.com -l -r randread --group-bars
Creating a 3D graph showing IOPS.
fio-plot -i <benchmark_data_folder> -T "Title" -s https://louwrentius.com -L -r randread -t iops
Creating a 3D graph with a subselection of data
fio-plot -i <benchmark_data_folder> -T "Title" -s https://louwrentius.com -L -r randread -t iops -J 16 -M 16
Creating a latency histogram with a queue depth of 1 and numjobs is 1.
fio-plot -i <benchmark_data_folder> -T "Title" -s https://louwrentius.com -H -r randread -d 1 -n 1
Creating a line chart from different benchmark runs in a single folder
fio-plot -i <benchmark_data_folder> -T "Test" -g -r randread -t iops lat -d 1 8 16 -n 1
The same result but if you want markers to help distinguish between lines:
fio-plot -i <benchmark_data_folder> -T "Test" -g -r randread -t iops lat -d 1 8 16 -n 1 --enable--markers
It is also possible to change the line colors with the --colors parameter.
fio-plot -i <benchmark_data_folder> -T "Test" -g -r randread -t iops -d 1 2 4 8 --colors xkcd:red xkcd:blue xkcd:green tab:purple
Please note that you need to specify a color for each line drawn. In this example, four lines are drawn.
You can find a list of color names here. There is also a list of xkcd colors here (xkcd:'color name').
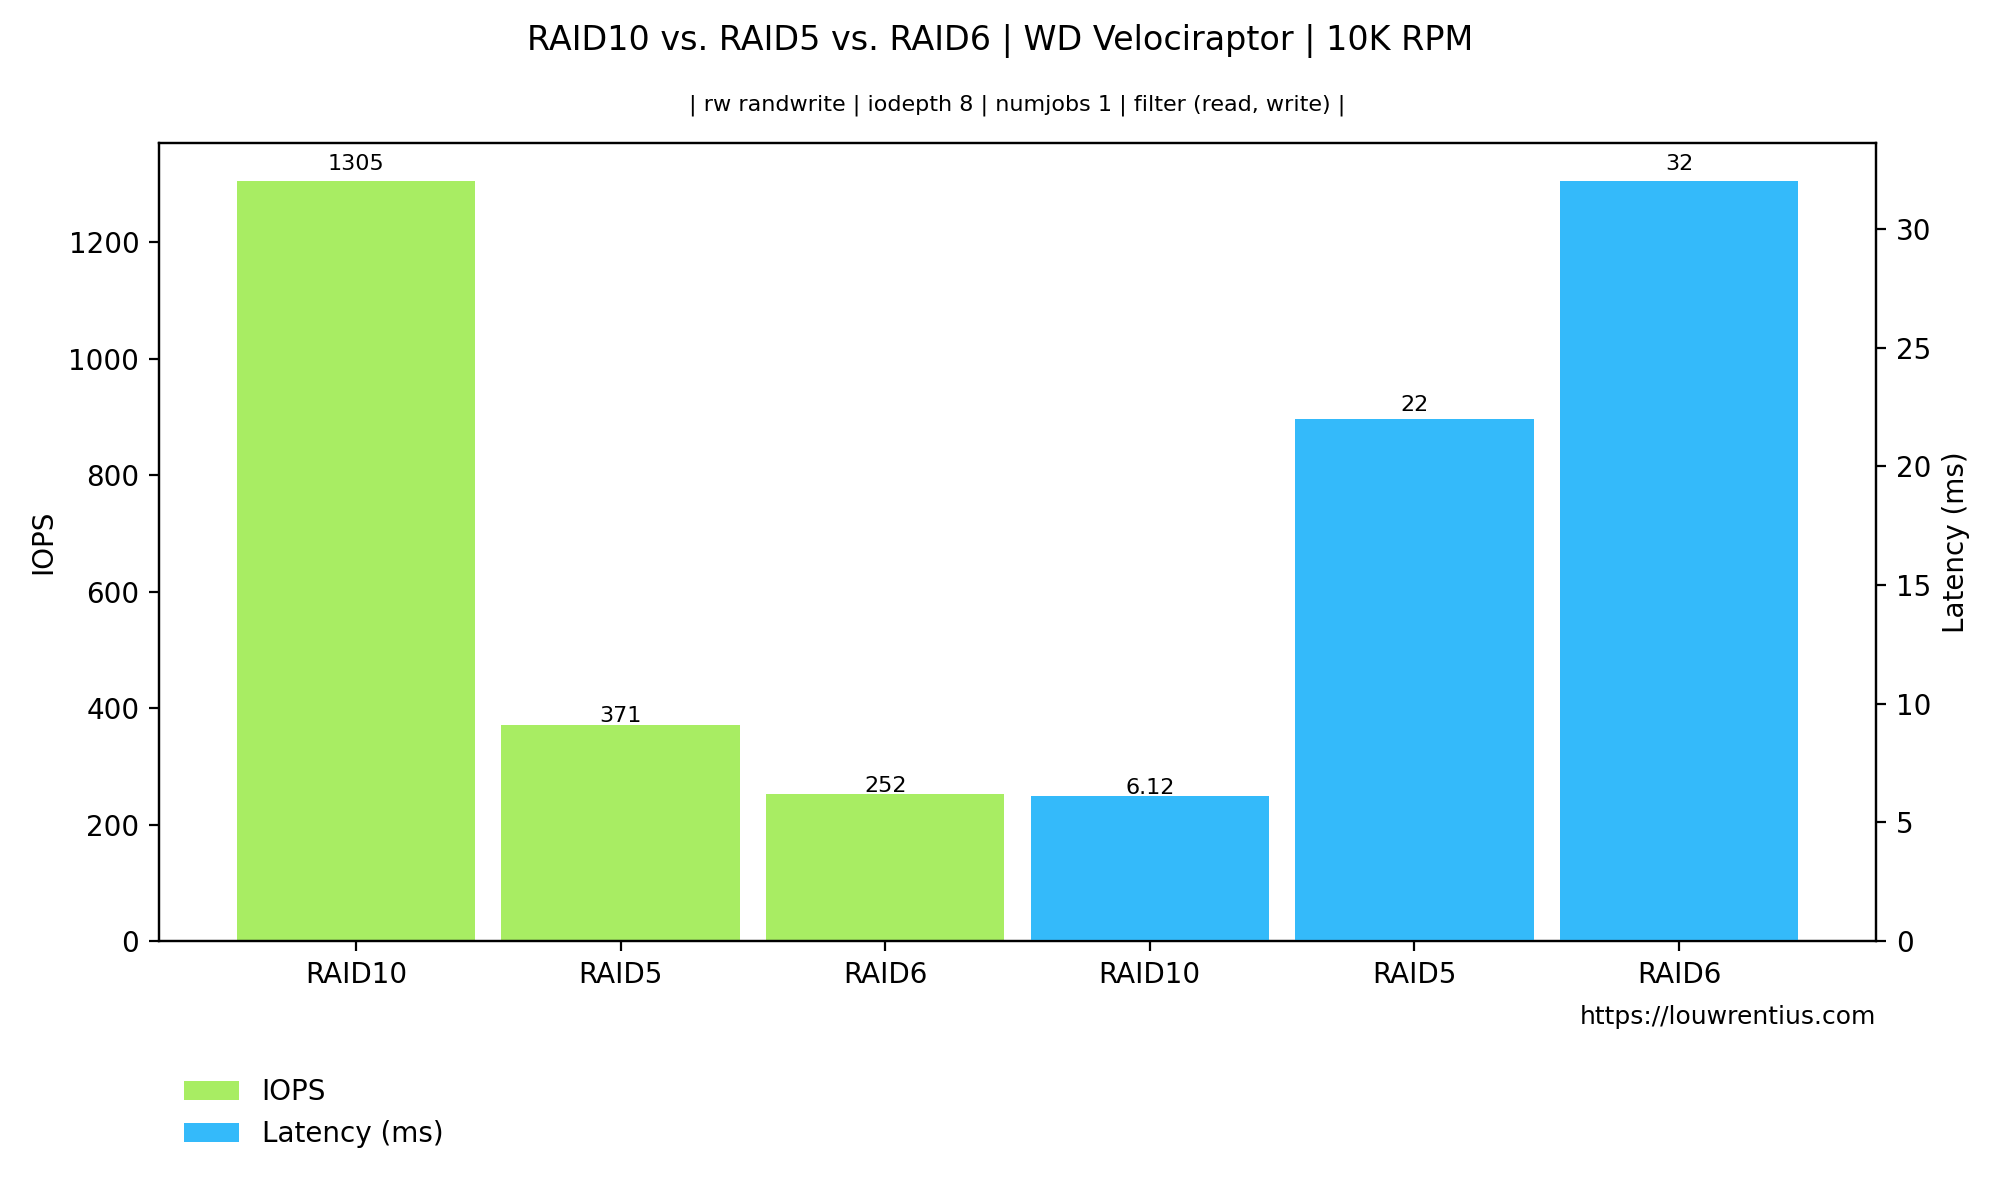
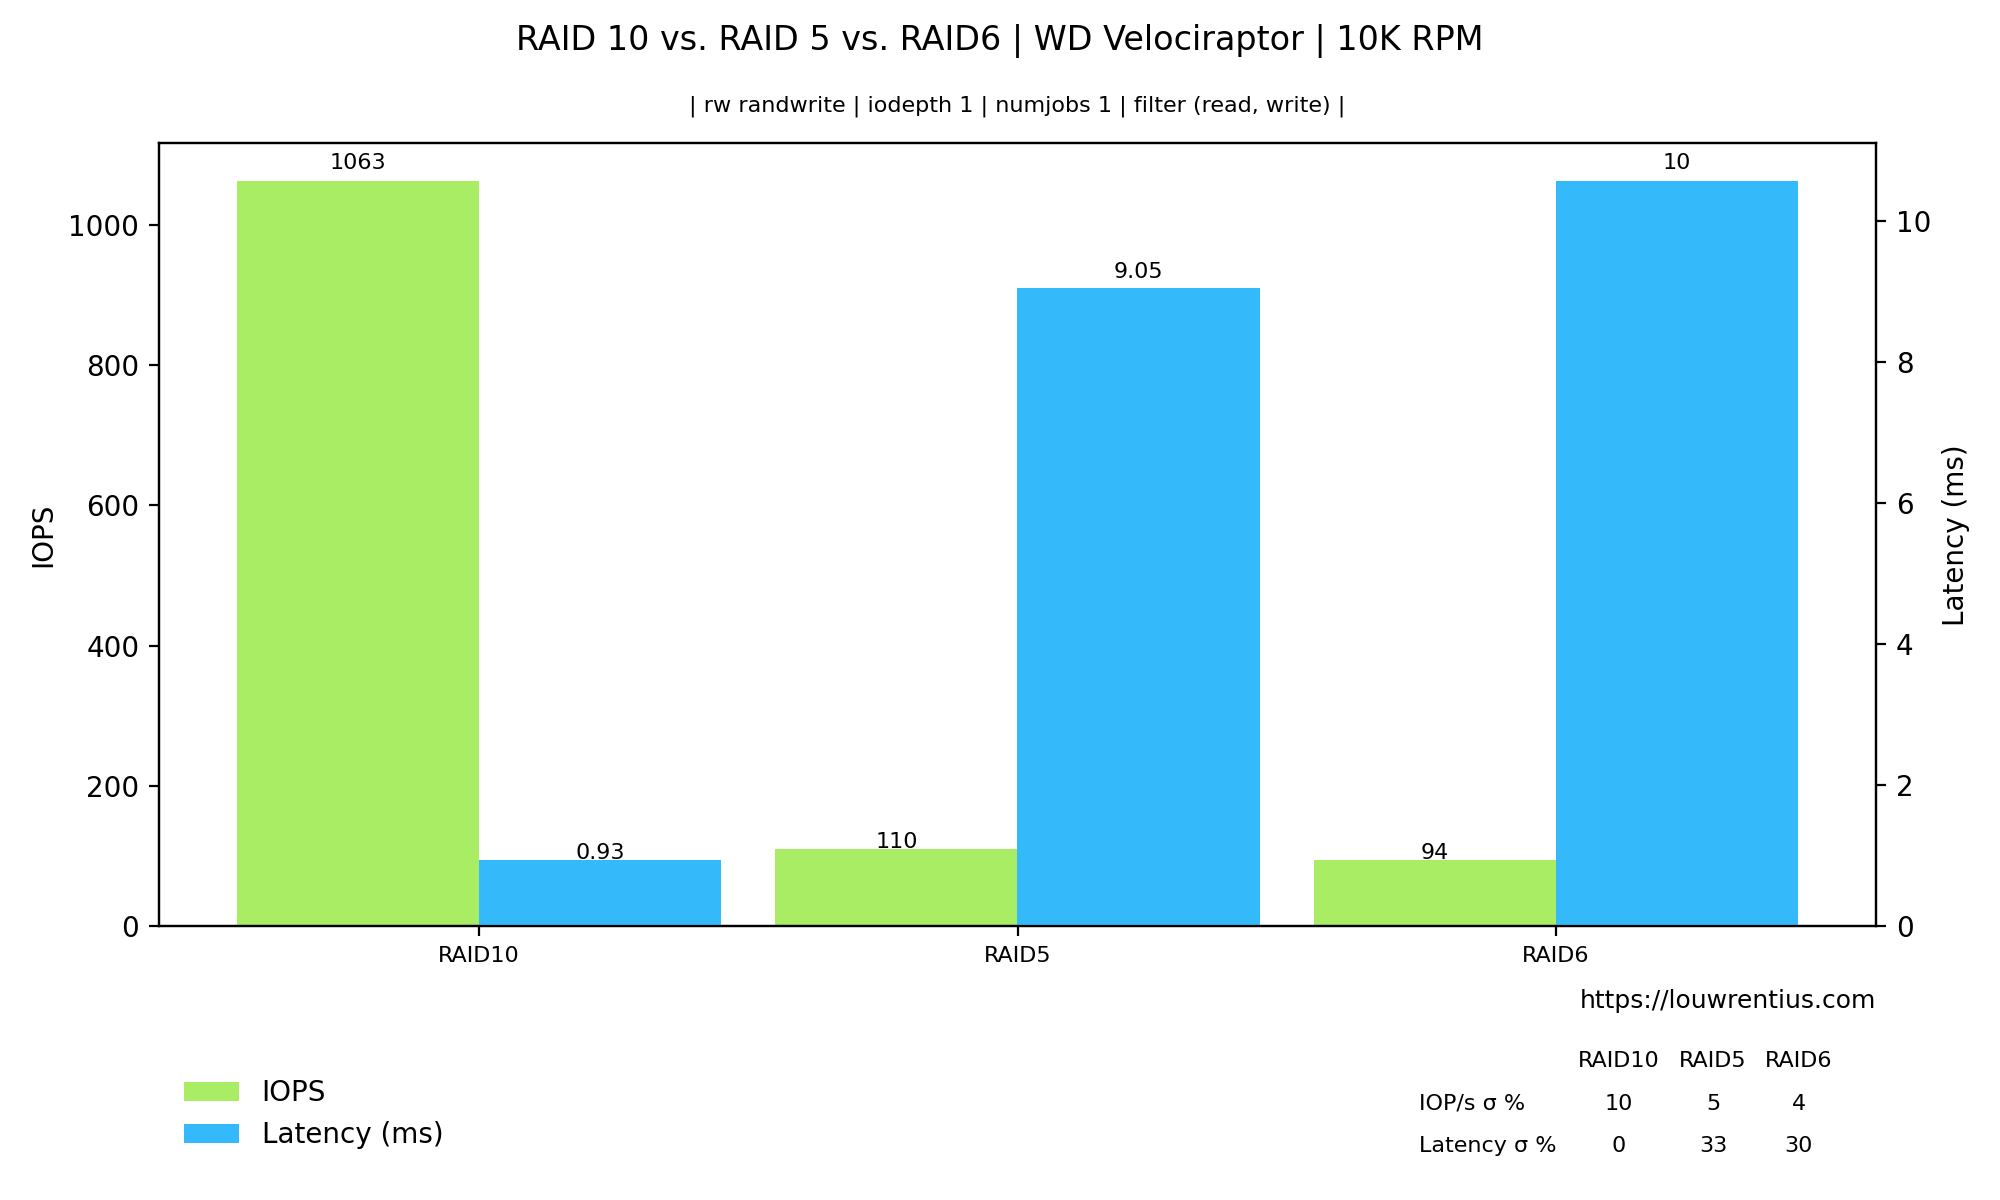
A simple example where we compare the iops and latency of a particular iodepth and numjobs value:
fio-plots -i <folder_a> <folder_b> <folder_c> -T "Test" -C -r randwrite -d 8
The bars can also be grouped:
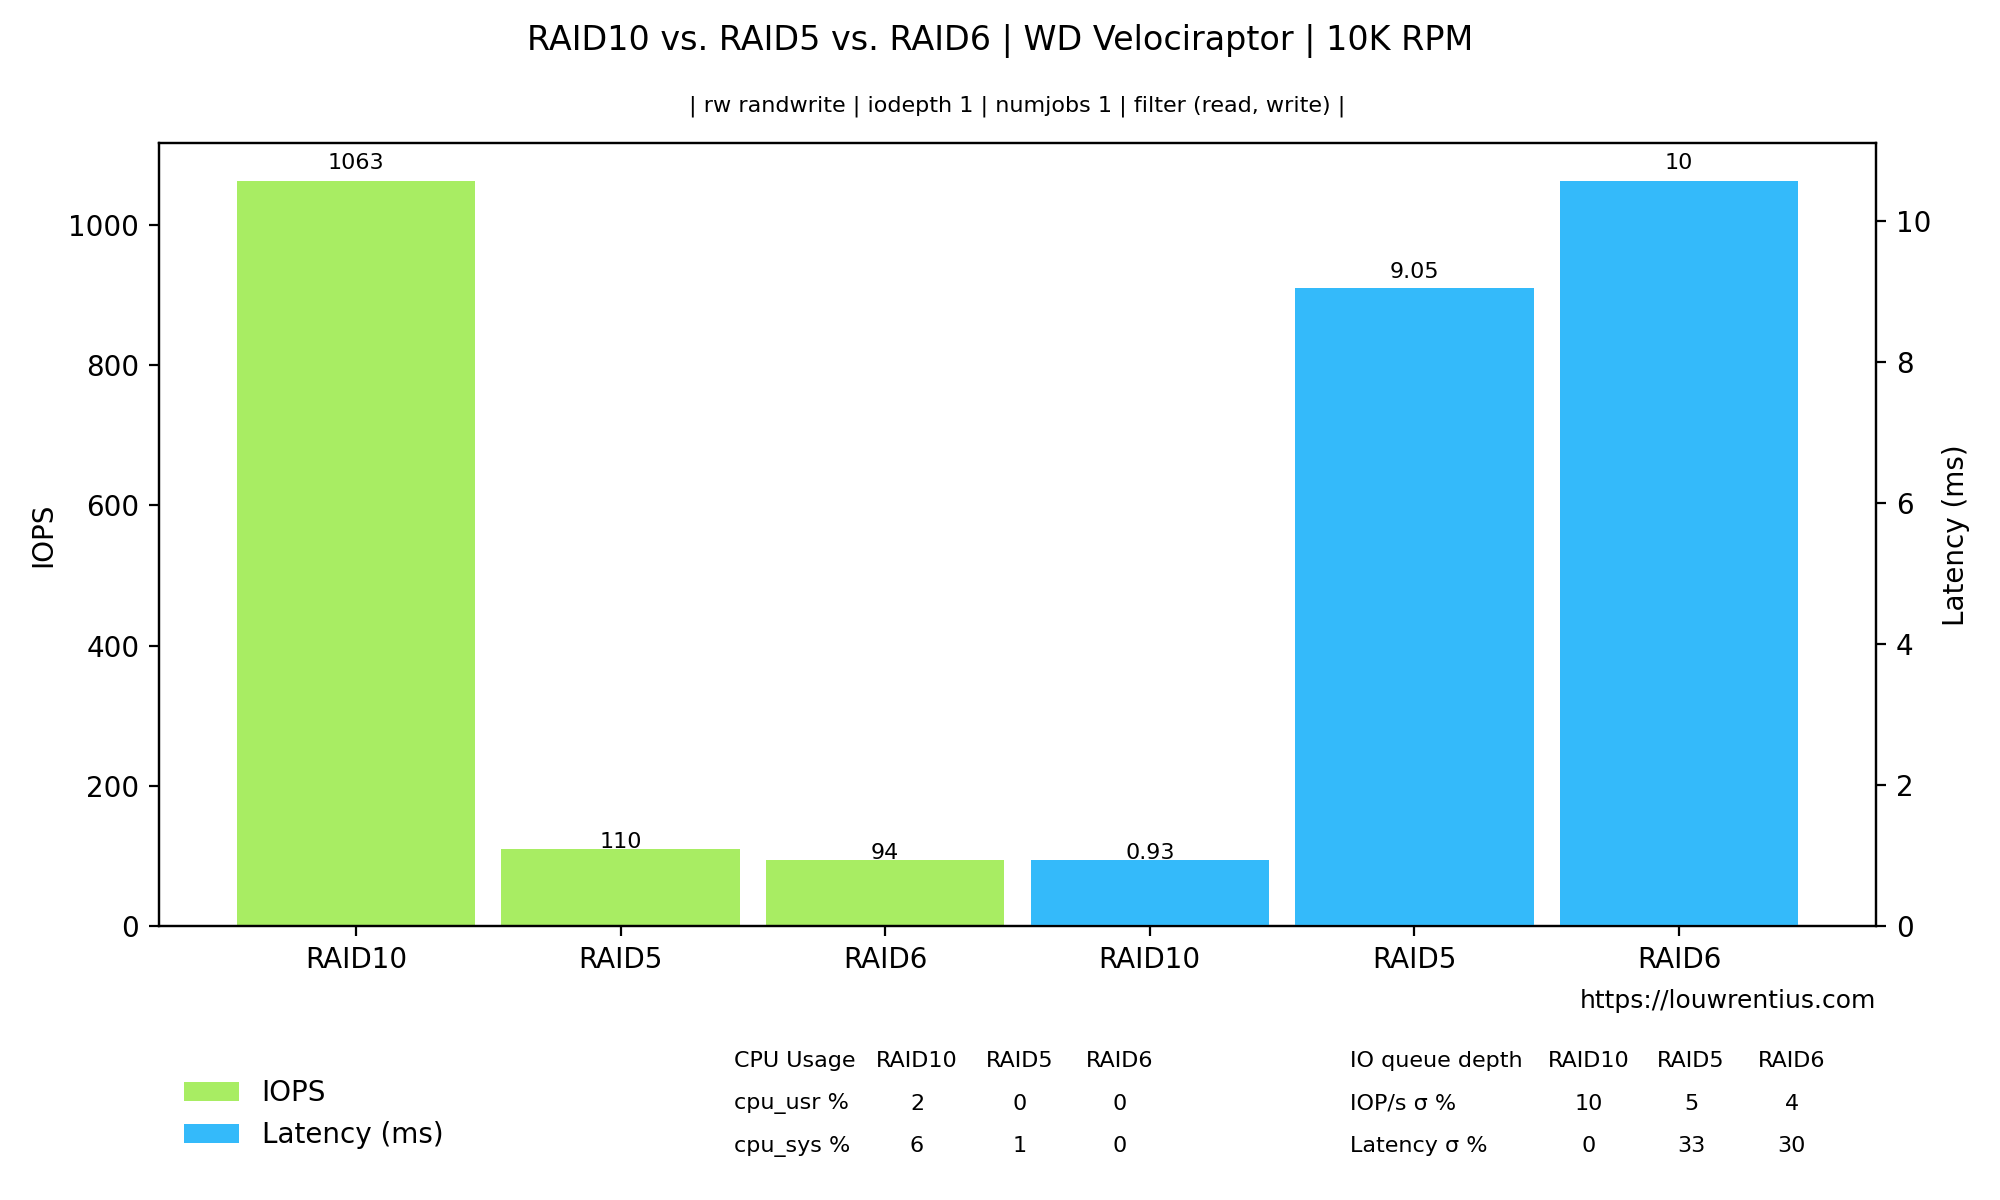
There is also an option (--show-cpu) that includes a table with CPU usage:
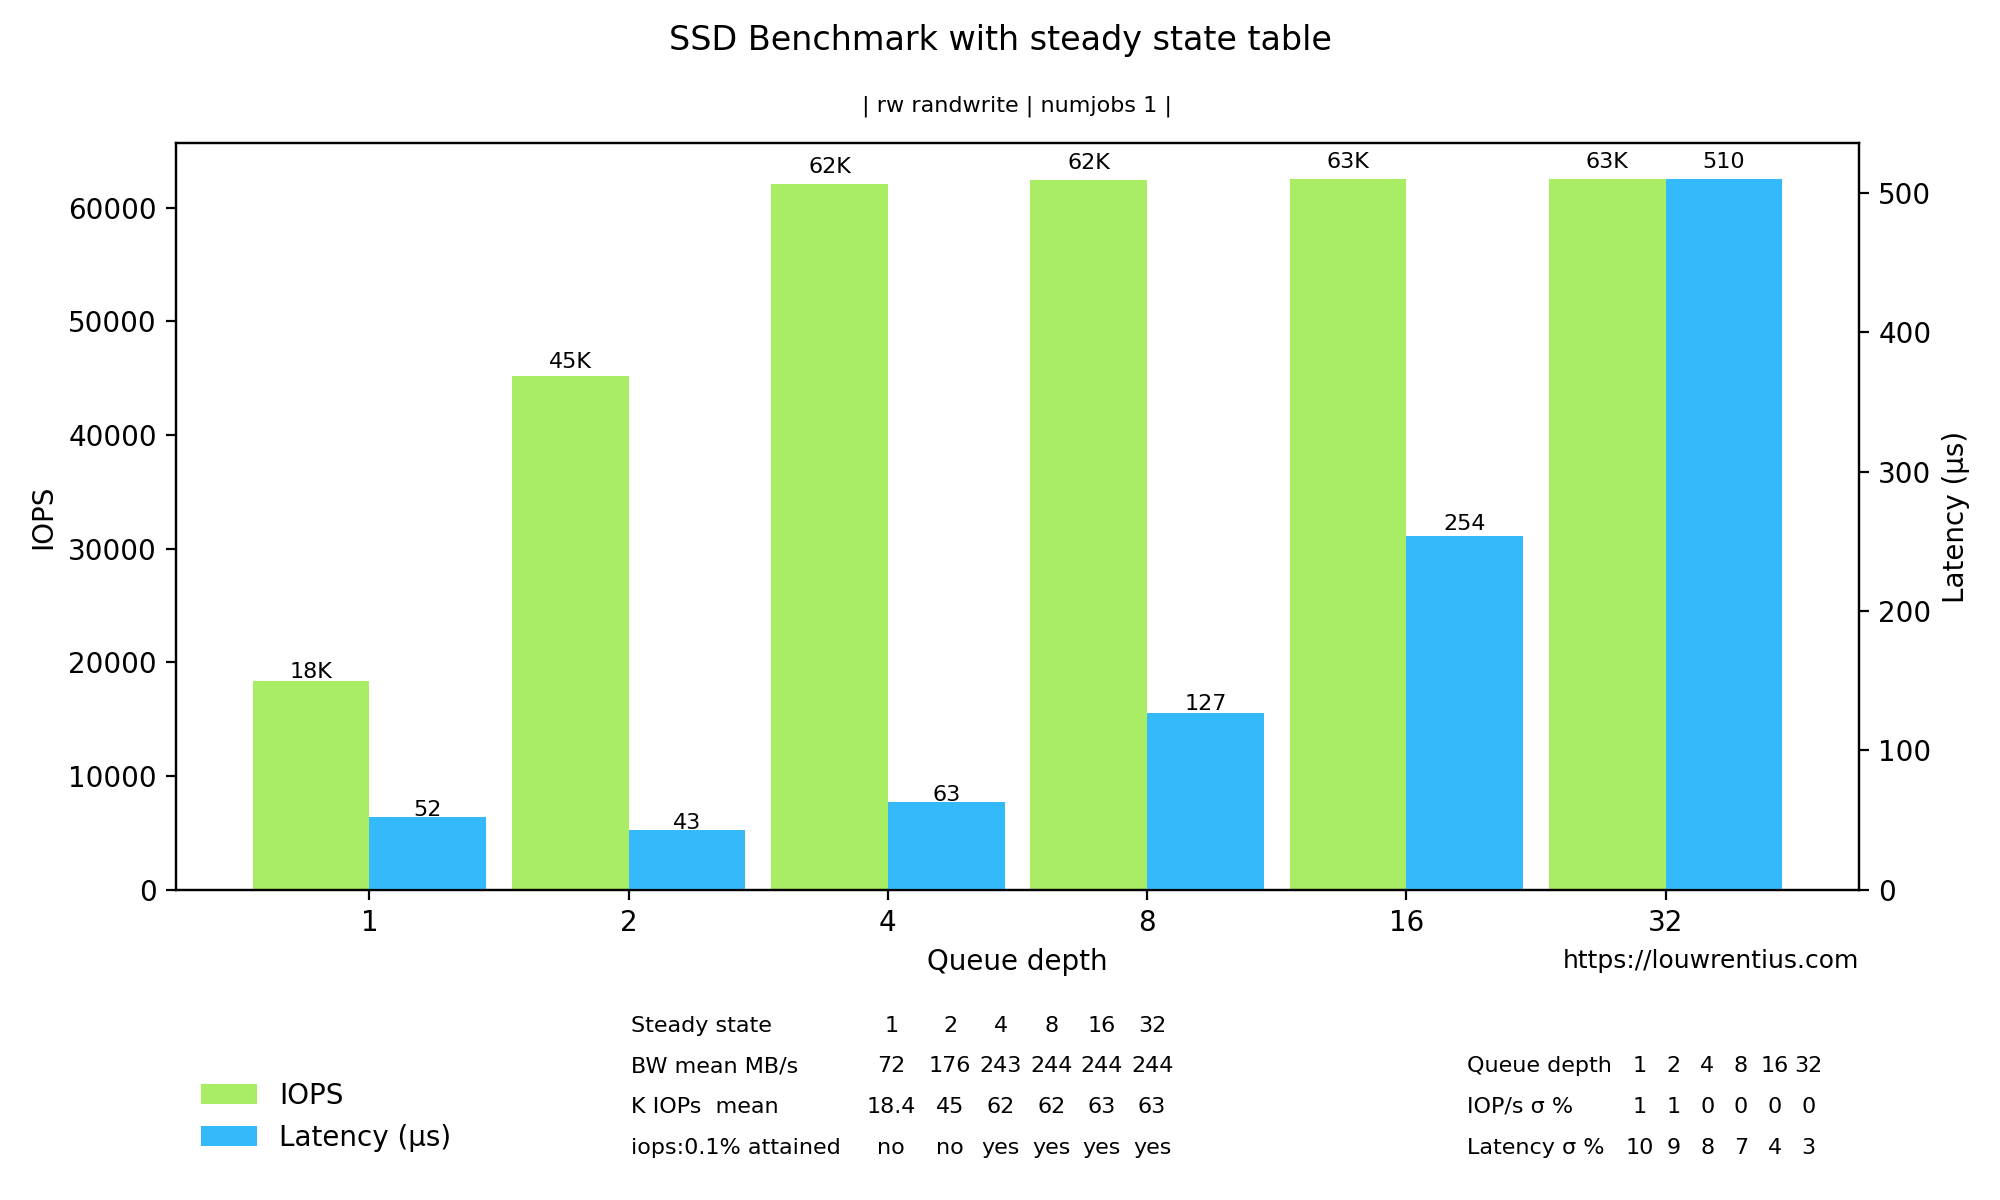
It is now also possible to show steady state statistics (--show-ss) if you ran a Fio benchmark with steady state options.
Create a line chart based on data from two different folders (but the same benchmark parameters)
fio-plot -i <benchmark_data_folder A> <benchmark_data_folder B> -T "Test" -g -r randread -t iops lat -d 8 -n 1
I'm assuming that the benchmark was created with the (included) bench-fio tool.
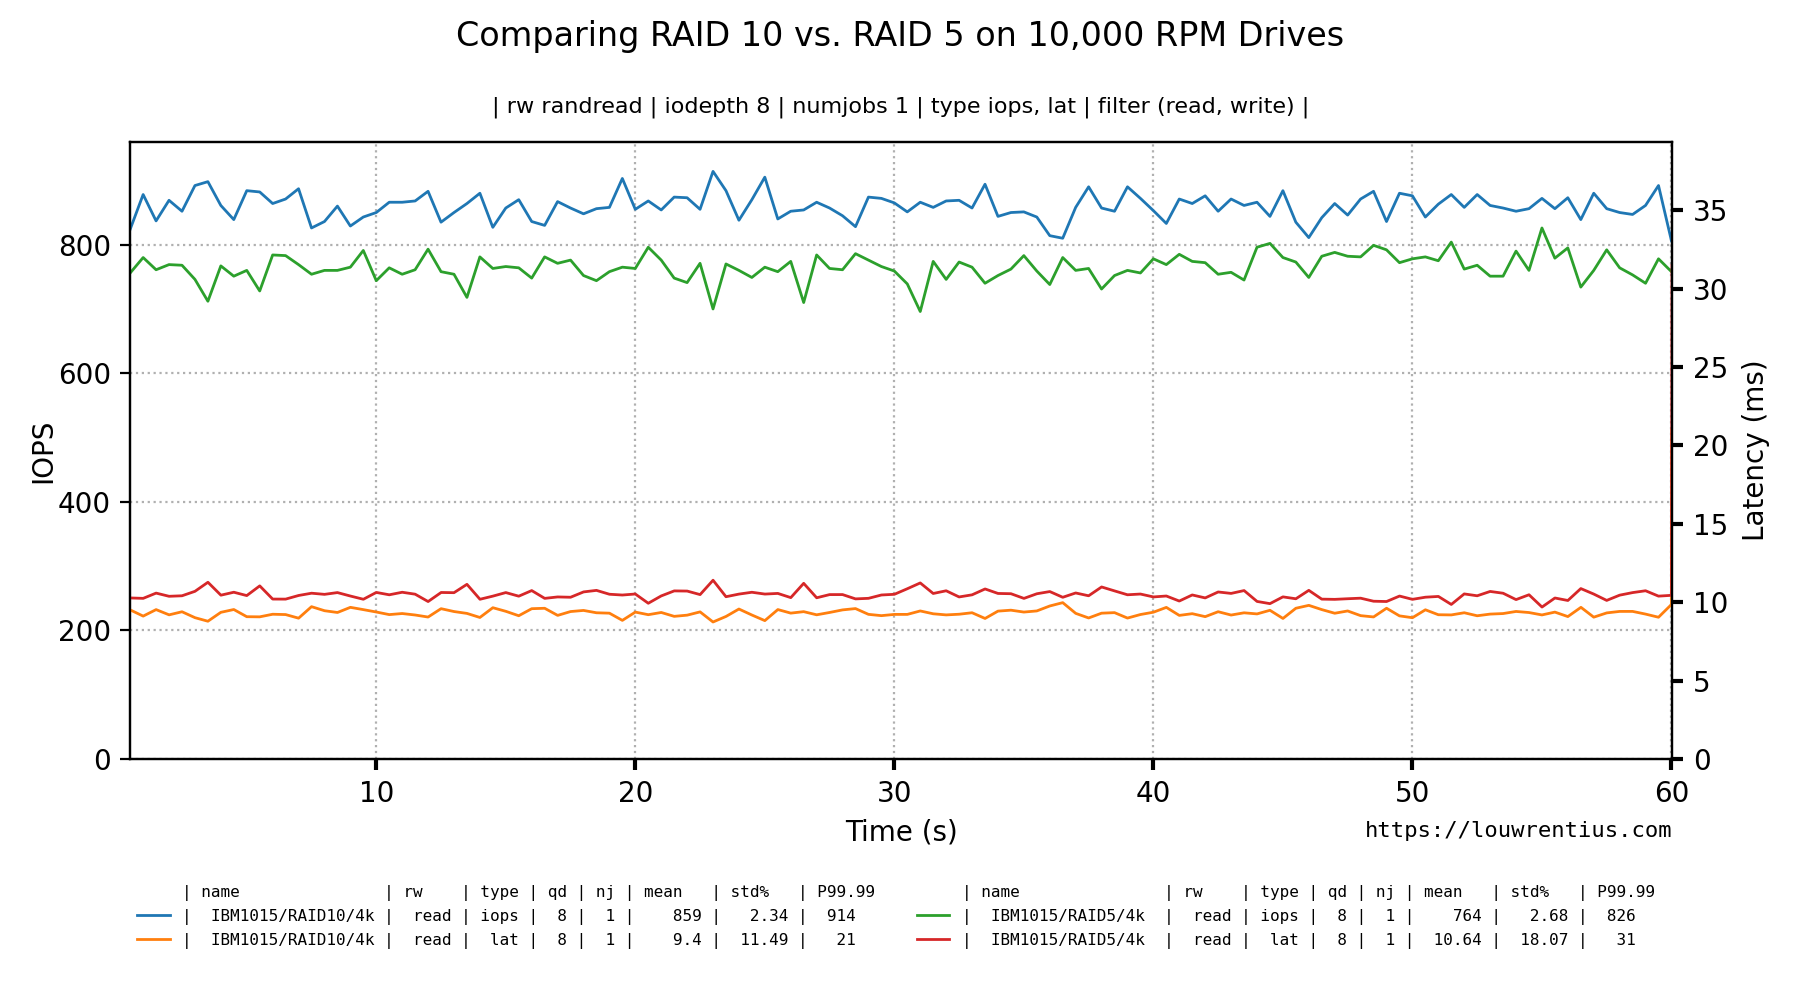
For example, you can run a benchmark on a RAID10 setup and store data in folder A. Store the benchmark data for a RAID5 setup in folder B and you can compare the results of both RAID setups in a single Line graph.
Please note that the folder names are used in the graph to distinguish the datasets.
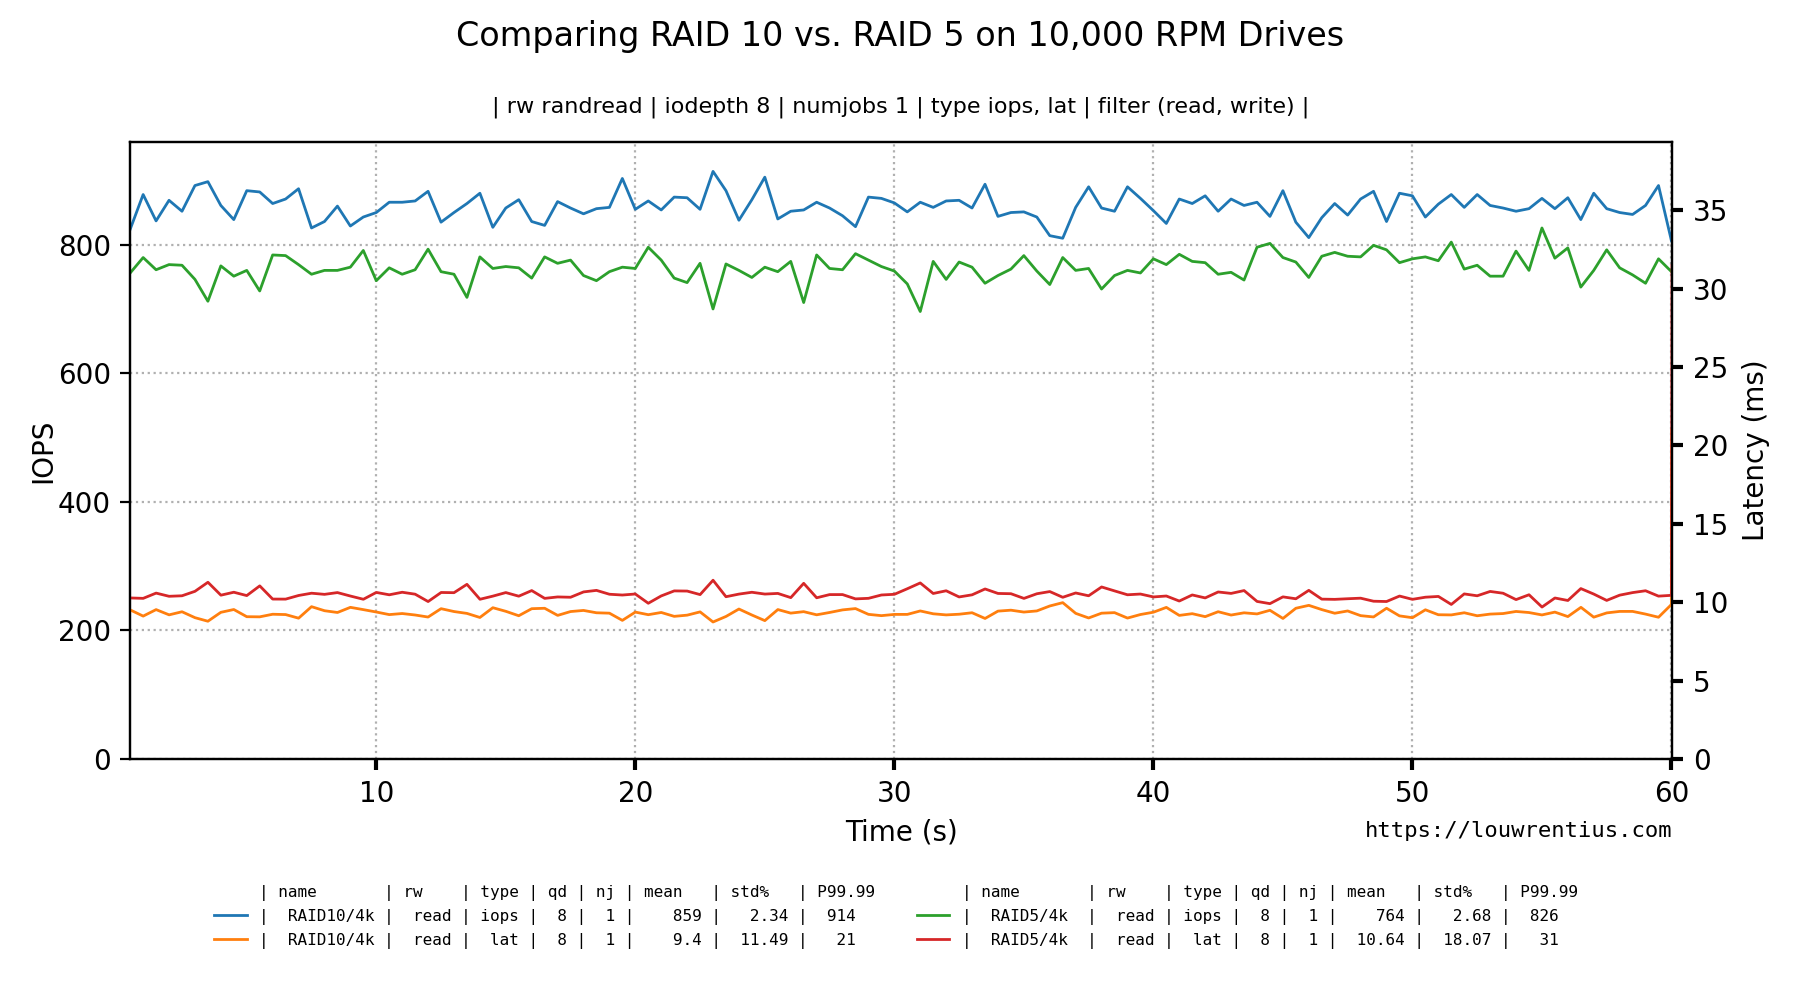
Command used:
fio-plot -i ./IBM1015/RAID10/4k/ ./IBM1015/RAID5/4k/ -T "Comparing RAID 10 vs. RAID 5 on 10,000 RPM Drives" -s https://louwrentius.com -g -r randread -t iops lat -d 8 -n 1
If you use the bench-fio tool to generate benchmark data, you may notice that you end up with folders like:
IBM1015/RAID10/4k
IBM1015/RAID5/4k
Those parent folders are used to distinguish and identify the lines from each other. The labels are based on the parent folder names as you can see in the graph. By default, we use only one level deep, so in this example only RAID10/4k or RAID5/4k are used. If we want to include the folder above that (IBM1015) we use the --xlabel-parent parameter like so:
fio-plot -i ./IBM1015/RAID10/4k/ ./IBM1015/RAID5/4k/ -T "Comparing RAID 10 vs. RAID 5 on 10,000 RPM Drives" -s https://louwrentius.com -g -r randread -t iops lat -d 8 -n 1 -w 1 --xlabel-parent 2
This would look like:
Some additional examples to explain how you can trim the labels to contain exactly the directories you want:
The default:
RAID10/4k
Is equivalent to --xlabel-parent 1 --xlabel-depth 0. So by default, the parent folder is included. If you strip off the 4k folder with --xlabel-depth 1, you'll notice that the label becomes:
IBM1015/RAID10
This is because the default --xlabel-parent is 1 and the index now starts at 'RAID10'.
If you want to strip off the 4k folder but not include the IBM1015 folder, you need to be explicit about that:
--xlabel-parent 0 --xlabel-depth 1
Results in:
RAID10
Example:
Fio-plot parses the filename of the generated .log files. The format is:
[rwmode]-iodepth-[iodepth]-numjobs-[numjobs]_[fio generated type].[numbjob job id].log
An example:
randwrite-iodepth-8-numjobs-8_lat.1.log
randwrite-iodepth-8-numjobs-8_lat.2.log
randwrite-iodepth-8-numjobs-8_lat.3.log
randwrite-iodepth-8-numjobs-8_lat.4.log
randwrite-iodepth-8-numjobs-8_lat.5.log
randwrite-iodepth-8-numjobs-8_lat.6.log
randwrite-iodepth-8-numjobs-8_lat.7.log
randwrite-iodepth-8-numjobs-8_lat.8.log
In this example, there are 8 files because numjobs was set to 8. Fio autoamatically generates a file for each job. It's important that - if you don't use the included benchmark script - to make sure files are generated with the appropriate file name structure.
All settings used to generate the PNG file are incorporated into the PNG file as metadata (tEXT). This should help you to keep track of the exact parameters and data used to generate the graphs. This metadata can be viewed with ImageMagick like this:
identify -verbose filename.png
This is a fragment of the output:
Properties:
    compare_graph: True
    date:create: 2020-09-28T16:27:08+00:00
    date:modify: 2020-09-28T16:27:07+00:00
    disable_grid: False
    dpi: 200
    enable_markers: False
    filter: ('read', 'write')
    histogram: False
    input_directory: /Users/MyUserName/data/WDRAID5 /Users/MyUserName/data/WDRAID10
    iodepth: 16
    bargraph3d: False
    latency_iops_2d: False
    line_width: 1
    loggraph: False
    maxdepth: 64
    maxjobs: 64