degPatterns results exists unsimilar pattern in a cluster #28
Comments
|
Hi @etbuface, thank you for the details. This function works in the following way: 1-make pair-wise correlations between the input genes (that they should be significant genes defined by some other method, like DESeq2) The third point is the one will define the cluster you see. With Consensus Cluster option one, it may give better clusters, but it is not always the case. This option will use the ConsesusCluster package to define groups. It is normal to find clusters that go almost identical, but you can see there is always a little different. I use the plot to then merge the groups to make more sense with your biology. If that little difference is not important, it makes sense to put all together. It is common as well to find some genes that show a bigger difference when you plot the non-scale value, but the scale value should show the same pattern, even if the difference is not equal. There is a couple of plots in the output of the function if you save it into a variable that may help you define the cutoff (http://lpantano.github.io/DEGreport/reference/degPatterns.html#value At the end of the days, the last step is arbitrary, and some genes will go to a cluster even if they are not similar because when you cut the tree they will be part of a group. That is the reason I added You are right about scale, it shouldn't be different, it is more a historical parameter and I probably should remove it. I hope this helps. |
Hi, i'm using degPatterns to cluster some genes across different time points.
here is part of my code :
clusters <- degPatterns(log2(salld.norm), metadata = colData, time = "age", minc = 5, reduce = T, scale = T)And here is my metaData :
Figure 1
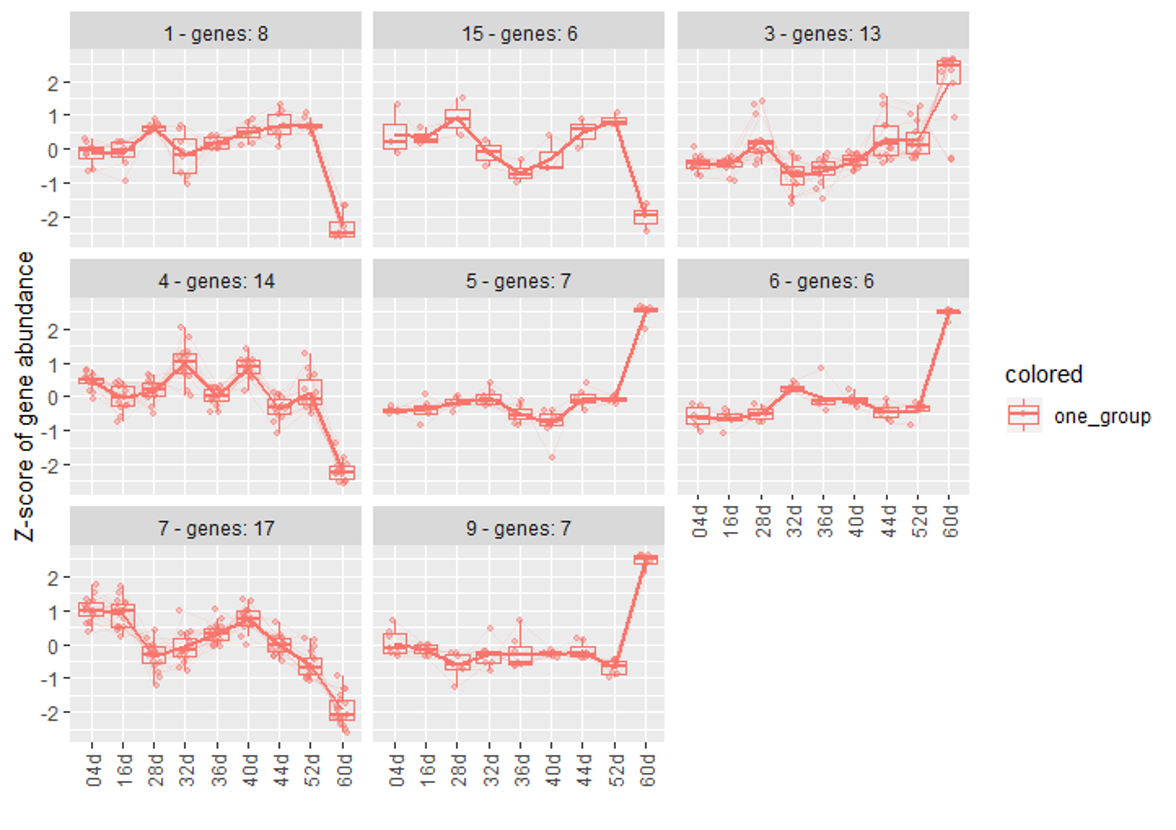
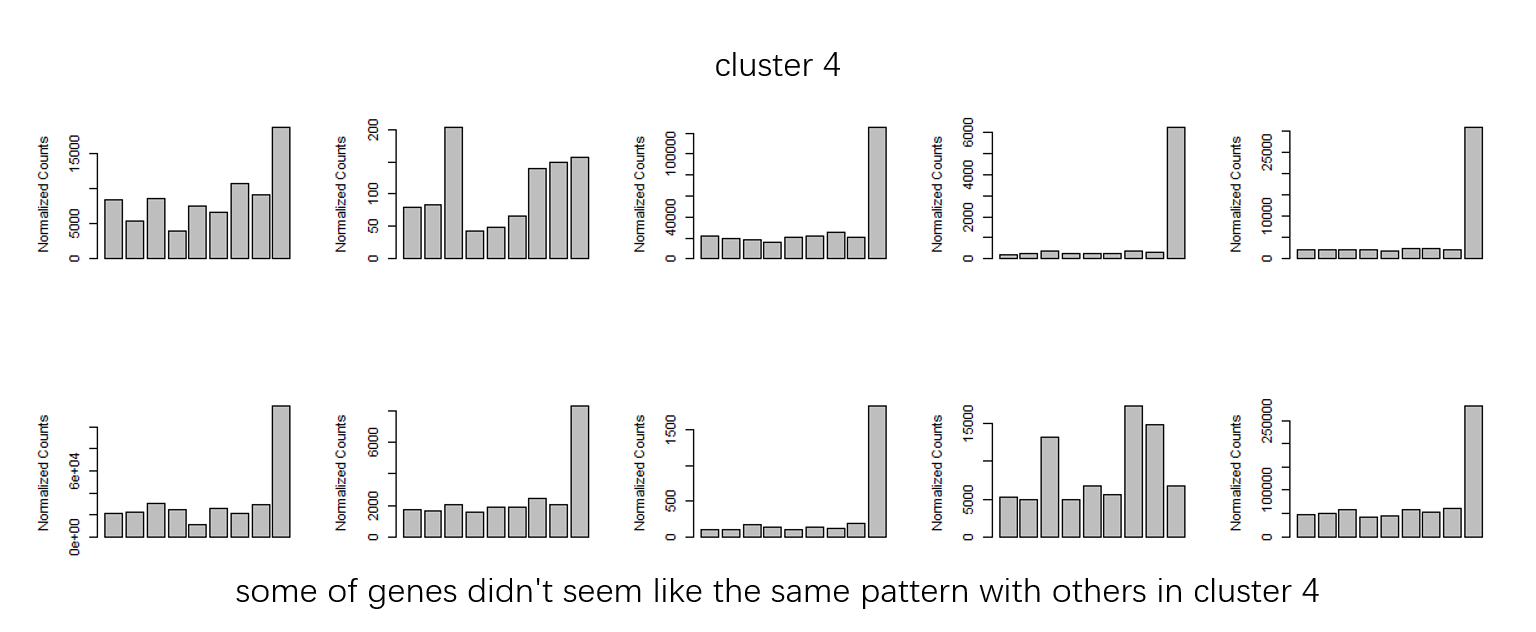
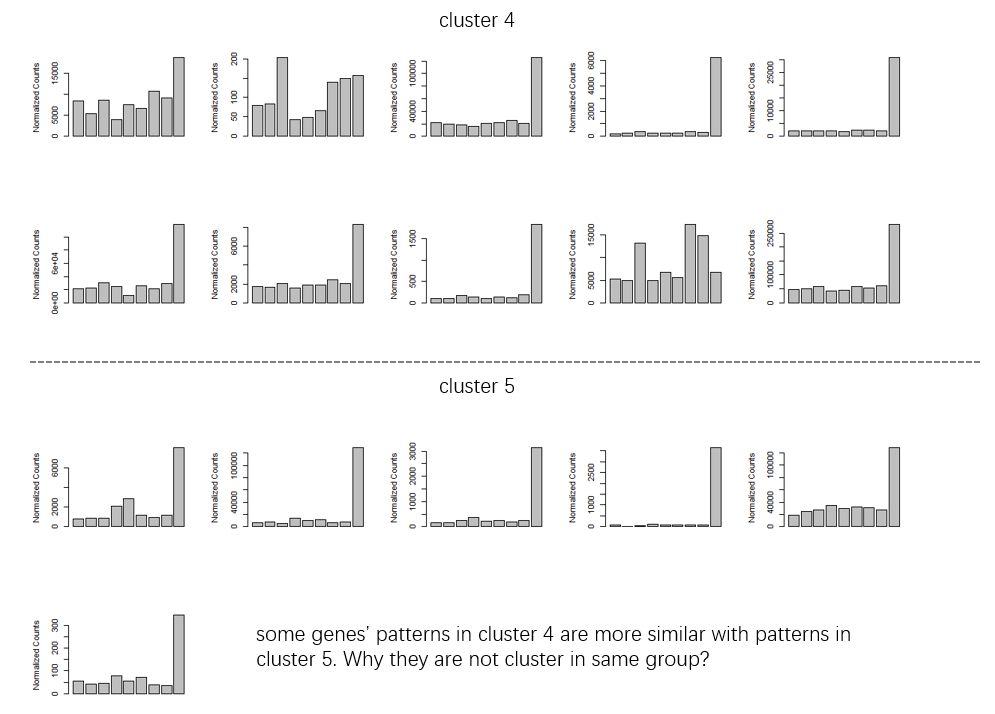
Figure 2
groupDifferenceto cluster more similar genes to one clutser. ( some of clusters seems very similar in my opinion. I don't know why they are divided into multiple clusters.)Figure 3
minc = 5to get more return clusters andreduce = Tto remove some outliers in clusters. I also usescale = T. Because i just care about the change pattern not the exact count. But i'm also curious that ifscale = Tis necessary. Thekendalltest is based on the data rank, right? So what's the influence ofscale = T? Is my understanding of the above parameters correct? I also noticed that there may be some ridiculous outlier if not using thereduce = T. How could these genes cluster with those 'consensus/common' genes?The text was updated successfully, but these errors were encountered: