Plot Optimization Results
HyperMapper provides a method to plot the optimization results for mono-objective applications. Results are plotted in terms of the optimization's simple regret, defined as the difference between the best function value found at each iteration and the minimum of the function being optimized. The script can also be used to compute the mean regret (with standard deviation) of multiple optimization runs or to compare the mean regrets of different optimizers or different optimization runs. For functions with two objectives, see Plot Pareto, for functions with more than two objectives, see Plot HVI.
The input to the script is:
- A json file containing the parameters of the exploration, prepended by
-j. - One or more directories containing csv files, in the same format as the output generated by HyperMapper, prepended by
-i.
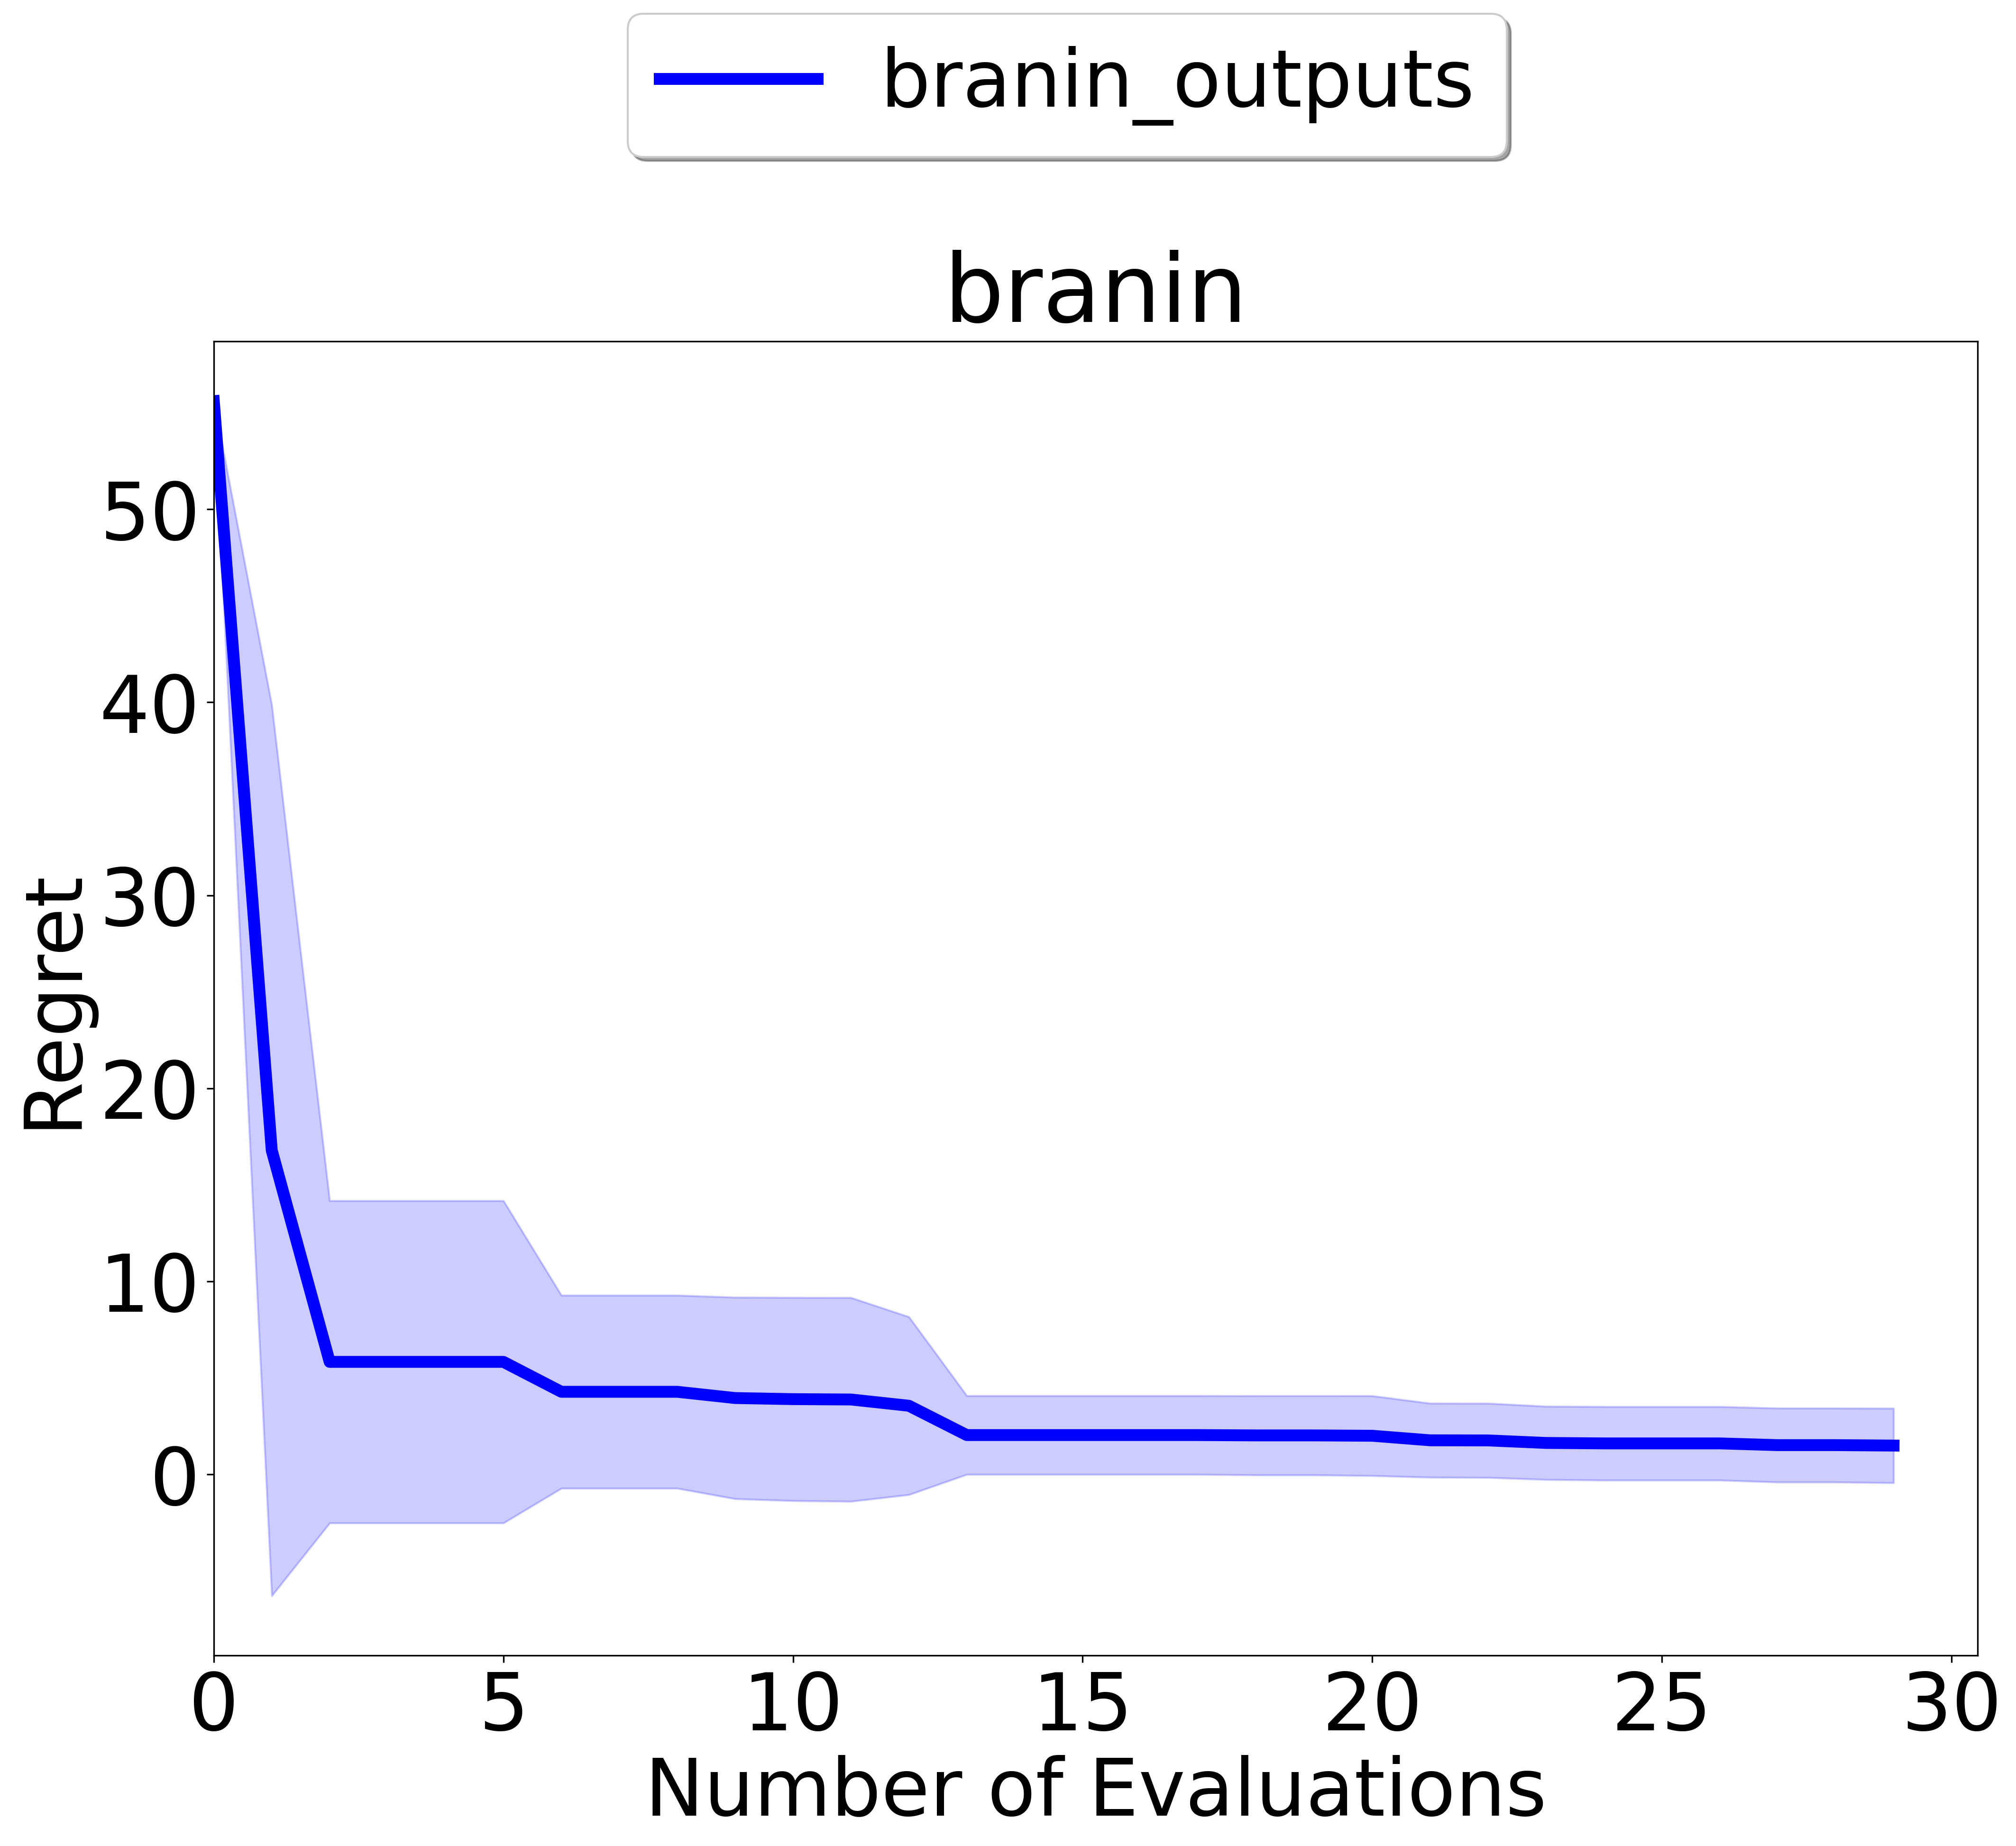
hm-plot-optimization-results -j example_scenarios/quick_start/branin_scenario.json -i branin_outputsThis will plot an image with the mean regret and standard deviation across all output files in the branin_outputs directory:
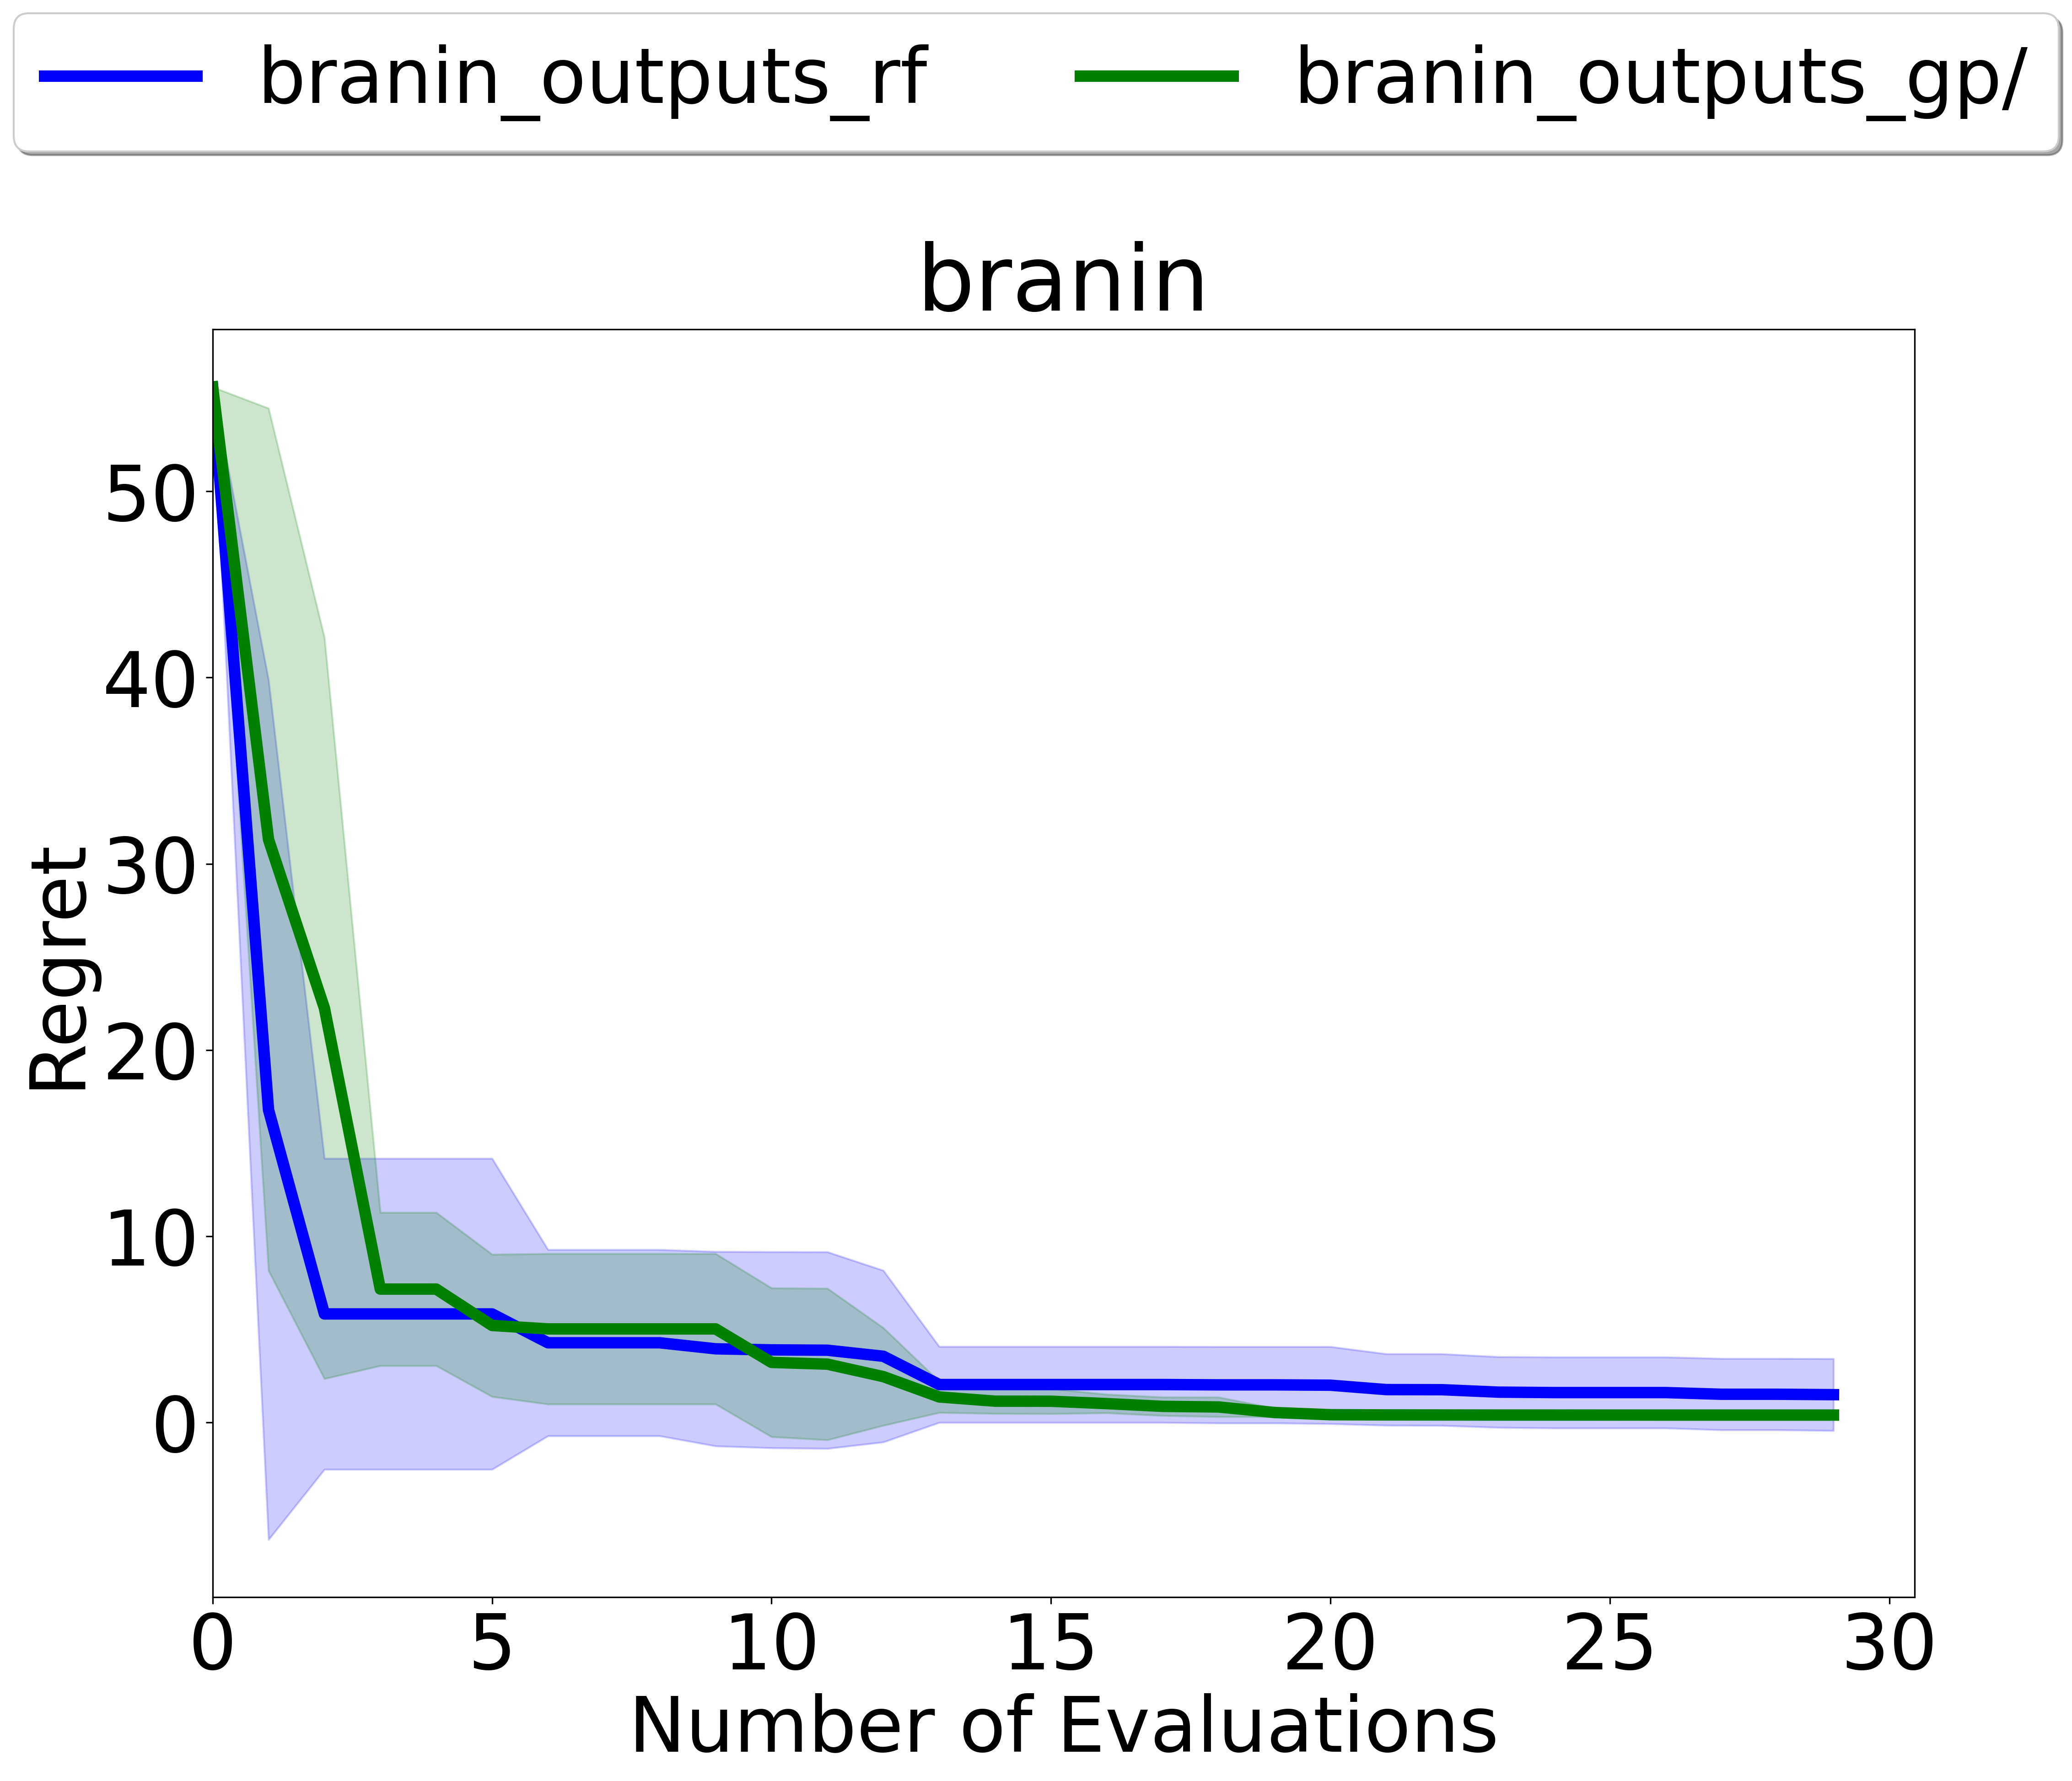
hm-plot-optimization-results -j example_scenarios/quick_start/branin_scenario.json -i branin_outputs_rf branin_outputs_gpThis will plot an image with a comparison of the mean regret and standard deviation across the files in the branin_outputs_rf and branin_outputs_gp directories:
The method also supports a number of optional arguments:
-
--labelsor-lfollowed by a list of strings. A list of labels, one for each directory, containing the labels to use in the plot legend. Default: directory names. -
--minimumor-minfollowed by a number. The true minimum of the function used to compute regret. Default: 0. -
--output_fileor-ofollowed by a string. The name of the output image file. Default: "[application_name]_regret.pdf". -
--output_diror-odfollowed by a string. An output directory to save the image. Default: current directory. -
--budgetor-bfollowed by an integer. The number of optimization iterations to plot. Default: If not provided, the entire optimization will be plotted. -
--titleor-tfollowed by a string. The plot title. Default: "[application_name]". -
--x_labelor-xlfollowed by a string. The name of the x-axis. Default: "Number of Evaluations". -
--y_labelor-ylfollowed by a string. The name of the y-axis. Default: "Regret". -
--ncolor-ncfollowed by an integer. The number of columns in the legend. Default: 4. -
--plot_logor-log. Plot simple regret on a logarithmic scale. -
--unlog_y_axisor-unlog. Only applied when--plot_logis set. After plotting, show simple regret values on the y-axis, instead of the log of the simple regret. -
--show_doeor-doe. Show the design of experiment phase with a vertical dashed line on the plot. -
--expert_configurationor-expfollowed by a number. Adds a horizontal line on the plot at the value provided. Used to add a baseline from previous experiments or manual optimization to the plot. Added to the legend as "Expert Configuration".