| title | author | date | output | ||||||||||||||
|---|---|---|---|---|---|---|---|---|---|---|---|---|---|---|---|---|---|
MTL Session 2 - Learner See |
Team PSD |
May 2019 |
|

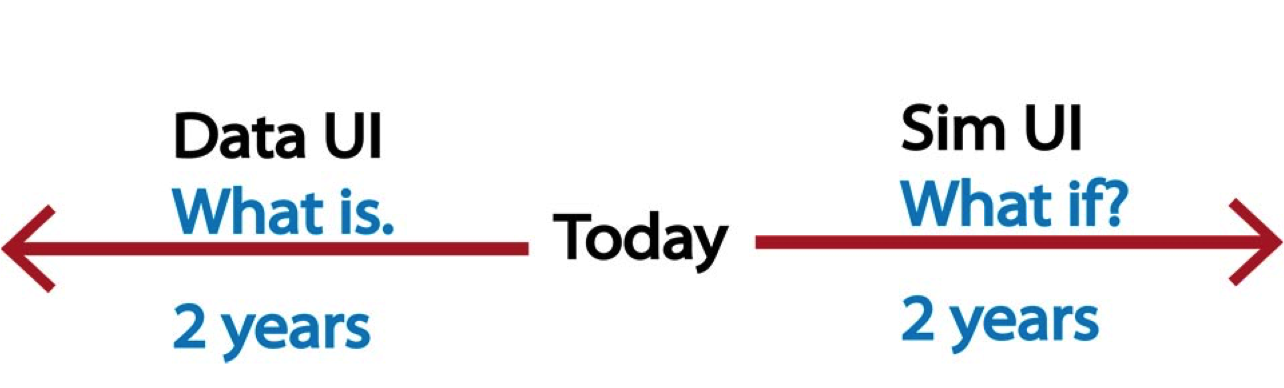
 We identified our Team Vision, selected our Team Lead and set a standing team meeting time. We logged in to mtl.how/data to look at the splash page. We identified our Team Vision, selected our Team Lead and set a standing team meeting time. We logged in to mtl.how/data to look at the splash page.  |
We will select and review Team Data for MTL.  |
![]()
- Describe the decisions your team made in producing your team data table.
- Test out whether your expectations about team historical trends are displayed in the "viz" tabs.
- Apply your clinical expertise to identify new information about a team patient in the "data" tabs.
1. Using the Internet Explorer browser, go to mtl.how/data. First select your VISN and then select your facility.


-
Click on the View dropdown. What View options are there and what do they mean?
- Count: Aggregate Data for Viz trends
- Data: Sortable report of data
- Diag: Diagnostic data
- Enc: Encounter types of visits
- HF: Health Factors data related to visits
- Meas: Measures or flag names
- Viz: Visualization of trends
-
What filtering options are available?
- Filter to your clinic or division to see trends for the last two years.
3. Scroll to your team folder at the bottom of the page. Open the data_ui folder and open your data_ui file in Excel.
- Select your station using the control tab. If you have any issues with permissions, Team PSD can help you.
- Click "Get Clinic List" and it will pull in clinics for your facility.


- You can sort and filter by Clinic Name, Division Name, Physical Location, Primary and Secondary Stopcode.
- Or, if your team has designated provider clinics, you can select by provider name.
- Note: This will pull all clinics used in the last two years (including de-activated clinics: denoted by "ZZ"). You can see the de-activated clinics in column I.
- Follow the instructions in Box A2.
- After filtering, click add all. Fine tune your selections by double-clicking on the clinic name in column A (to remove) or column C (to add).
5. To view your team patient data and your team trends click on "Get-Patient-level Data." We will not do this in-session today.
- You already have a fresh data UI file to work with already in your team data folder.
- We will learn about the "Create Team Data Table for Sim UI" button in our next team meeting.
- On average (depending on the size of your team) it may take 15 minutes or so for your team data UI to pull in fresh data. And, Microsoft Excel will be unresponsive until the data UI has finished pulling in your data.

- There are team trends for diagnoses, encounters, health factor data (e.g., suicide plans, evidence-based practice templates), and measures from mental health assistant.
- What stands out to you?
- What is most important to you to check out first?
- What is most surprising?

- Patients who have requested restricted access to their information have asterisks (****) in Column F & G. If you are a VA provider, you can still identify patients from Column H.
- Patient information correponds to the same categories as the team trends: diagnoses, encounters, health factor data (e.g., suicide plans, evidence-based practice templates), and measures from mental health assistant.
- Providers can filter to find specific patients, or produce reports.
- What data tab would you use to find out how many current patients on the team are engaged in a specific evidence-based psychotherapy? What column shows you the session number (EBP template) that the patient is on?
- What viz tab would you use to see what the most common service encounters or visits are?
- Are there services that have been increasing over time? Are there services that have been descreasing over time?
With the team trends (viz) and team patient (data) information in the data UI, your team can efficiently use team meetings to focus on the interrelated issues of care coordination and team quality improvement.
| We selected the clinics that make up our team for the Team Data. |
Review the HF, Diag, Enc and SP tabs in Team Data to find a patient (zoom in) and find a team trend (zoom out). |