Code for "Leveraging Unlabeled Data to Track Memorization".
We conducted experiments under:
- python 3.7.10
- torch 1.7.1
- torchvision 0.8.2
- cuda 10.1
- jupyter-notebook 6.1.5
- ipython 7.19.0
- 1 Nvidia Titan X Maxwell GPU
- datasets.py: the code to get data loader for a given batch size, training set size and level of label noise.
- models folder: the folder that contains the neural network configurations that are used.
- experiments.py: the code to train the models and compute susceptibility to noisy labels in each epoch.
- results.ipynb: the code to plot figures after the execution of experiments.py is finished.
To train a resnet on the CIFAR-10 dataset with 50% label noise level, batch size=128, for 200 epochs run the following command:
python3 experiments.py --model resnet --filename <filename> --modelfilename <modelfilename>
The model is saved in ./checkpoint/ directoty and the results are saved in ./results/ directory. Running this script automatically computes susceptibility during training as well.
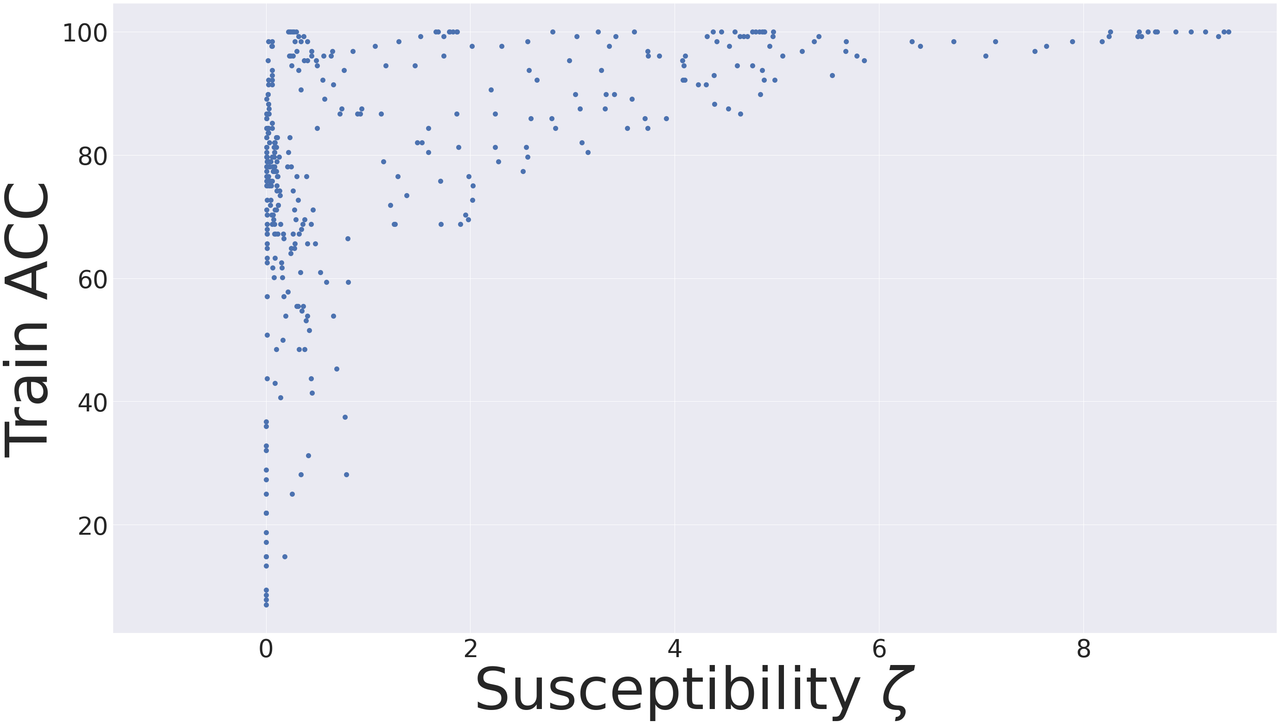
To illustrate how to use our method, below we provide our results for the Clothing1M dataset, which is a real-world dataset with 1M images of clothes. The images have been labeled from the texts that accompany them, hence there are both clean and noisy labels in the set. The ground-truth of the labels is not available (i.e., we do not know which samples have clean labels and which samples have noisy labels). Therefore we cannot explicitly track memorization as measured by the accuracy on a noisy subset of the training set, but we can use susceptibility as a metric, since it does not require access to the ground-truth labels. Although the labels of the training set are not clean, a held-out test set with clean labels is available, in addition to the training set. We do not use this held-out clean set during training, but use it only to evaluate the performance of our approach based on susceptibility.
We train 19 different settings on this dataset with various architectures (ResNet, AlexNet and VGG) and varying learning rates and learning rate schedulers. We compute the training accuracy and susceptibility during the training process for each setting and visualize the results in the figure below.
We divide the models of the above figure into 4 regions, where the boundaries are set to the mean value of the training accuracy (horizontal line) and mean value of susceptibility (vertical line): Region 1: Models that are trainable and resistant to memorization, Region 2: Trainable and but not resistant, Region 3: Not trainable but resistant and Region 4: Neither trainable nor resistant. This is shown in the figure below.

Our approach suggests selecting models in Region 1 (low susceptibility, high training accuracy). In order to assess how our approach does in model-selection, we can reveal the test accuracy computed on a held-out clean test set in the figure below. We observe that the average (± standard deviation) of the test accuracy of models in each region is as follows:
-
Region 1: 61.799% ± 1.643
-
Region 2: 57.893% ± 3.562
-
Region 3: 51.250% ± 17.209
-
Region 4: 51.415% ± 9.709

We observe that using our approach we are able to select models with a very high test accuracy. In addition, the test accuracies of models in Region 1 have the least amount of standard deviation. Note that our susceptibility metric
You can find the full version of the paper (including appendices) at https://arxiv.org/abs/2212.04461.
To cite our work, for the arxiv version, use:
@article{forouzesh2022leveraging,
  title={Leveraging Unlabeled Data to Track Memorization},
  author={Forouzesh, Mahsa and Sedghi, Hanie and Thiran, Patrick},
  journal={arXiv preprint arXiv:2212.04461},
  year={2022}
}
and for the published version, use:
@inproceedings{
forouzesh2023leveraging,
title={Leveraging Unlabeled Data to Track Memorization},
author={Mahsa Forouzesh and Hanie Sedghi and Patrick Thiran},
booktitle={The Eleventh International Conference on Learning Representations },
year={2023},
url={https://openreview.net/forum?id=ORp91sAbzI}
}