How To Draw A Line
HOME > TECHNICAL DOCUMENTATION > HOW TO DRAW A LINE
Lines are perhaps the most basic of geometric entities. Most of the complex geometric shapes can be reduced to a set of lines, which makes them an essential component for rendering graphics.
The general equation for a straight line in two dimensions is:
where:
is the slope of the line
c is the intercept on the Y axis
There are many algorithms available for rendering straight lines (with or without aliasing), but Bresenham's Line Algorithm is where to start. It's one of the cheapest algorithms in graphics since only integer additions & subtractions are involved! The only "issue" with Bresenham's algorithm is that the lines might appear jagged. Other algorithms address this gap by antialising (read smoothing out) the lines.

In Synesthesia, the Euclid sub-module of Grapheme is where Bresenham's line drawing algorithm is implemented. Due to constraints in resources, antialiasing is not done.
Lets have a look at how a straight line would fit onto a grid like canvas:
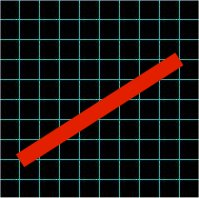
The aim is to derive the set of points on the grid, that most closely matches with this line:
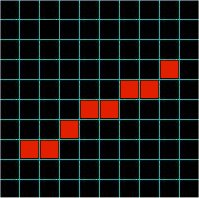
On first glance at the rendered line above, it appears that the x coordinate is always incremented when traversing the line, with occasional increments of the y coordinate. This should make sense given that the slope of the line is < 1 i.e. there are more increments of x than increments of y. The reverse holds true for slope > 1 i.e. there will be continuous increments of y coordinate as compared to x coordinate.
Lets now focus on only lines with slope < 1. So given that the x coordinate is always incremented, we only need to figure out when to increment the y coordinate. Bresenham's algorithm does this by keeping track of the deviation from the "true" line for each pixel, and increments the y coordinate if the deviation crosses a threshold.
Lets start with a point on the line. The next point on the true line is
where:
Now, we need to make a choice on the value of yi to be plotted on the grid; either yi itself, or yi + 1.
To do that, we need to know how far away each of these coordinates are from the true line. Hence:
We need to choose the y coordinate closer to the line, so the decision becomes:
Looking good so far. But the variable involves division, so lets try and remove this. Multiplying by
should do the trick. Lets now define another parameter:
Notice that the first set is a variable and depends on the current coordinates , while the second set is fixed since are fixed for a particular line. Lets assign the fixed part to:
Thus pi becomes:
So how will the decision equation change now that we have pi ? We can say that
Hence the decision is:
Great! We have now eliminated the need for floating point division from the equation. Now lets see how the equation for pi+1 will look like:
The quantity in brackets is nothing but pi.
We now have a recursive equation for pi. Its interesting to note that the quantity (yi+1 - yi) is either 0 or 1 depending on the decision taken:
Now, to determine the starting value of pi:
Eliminating c by substituting
Using this seed value of p0, we can calculate the next value of pi as well as take decisions to increment the y coordinate. This is the essence of Bresenham's line algorithm.
For slopes > 1, we can use the same algorithm but this time interchange x & y coordinates to say y' and x'. This will make sure that m' < 1 and the same algorithm can be used.
Below is the full algorithm in pseudo-code, taken from Wikipedia:
function line(x0, y0, x1, y1)
   dx := abs(x1-x0)
   dy := abs(y1-y0)
   if x0 < x1 then sx := 1 else sx := -1
   if y0 < y1 then sy := 1 else sy := -1
   err := dx-dy

   loop
     plot(x0,y0)
     if x0 = x1 and y0 = y1 exit loop
     e2 := 2*err
     if e2 > -dy then
       err := err - dy
       x0 := x0 + sx
     end if
     if x0 = x1 and y0 = y1 then
       plot(x0,y0)
       exit loop
     end if
     if e2 <  dx then
       err := err + dx
       y0 := y0 + sy
     end if
   end loop
endfunction