This script was specifically created to analyze the oscillations in length of bacterial chromosomes, which occur throughout cell cycle with varyimg periods. The script can deal with the samples with different number of time points as eash cell has different length of cell cycle.
FFT.m loads data from .mat files in dataFolder, calculates FFT and generates outputs based on input parameters
FFT(sampPeriod,binSize,zeroPadd,derivative,outputs)
input: .mat files in dataFolder; can be either num arrays arranged so column represents a single nucleoid length curve or cell arrays a(n,1) where each row contains a single nucleoid length curve
sampPeriod: temporal resolution of image acquisition in sec, can be a vector if datasets are taken with different temporal resolution [sec]
binSize: in mHz, the smallest desirable frequency difference; set if use zero padding
zeroPadd: 1 - zero padding, 2 - no zero padding, does not improve the resolution and produces side lobes but provide more accurate amplitude estimation
derivative: 1 - use signal derivative to calculate FFT ("velocity of displacement", small fast oscillations have higher energy), 0 - use signal to calculate FFT ("amplitude of displacement", large slow oscillations have higher energy)
outputs: [1 1 1 1 0.6 1 1 1 1 1 1 3] - vector of zeros and ones, if (outputs(i) == 1, generates:
- induvidual PSD spectra;
- avg PSD for all datasets (select only for zero-padded spectra);
- 2D energy vs period histogram;
- CDF histograms for all datasets (energy and period of the most intense FFT peaks);
- kernel smoothing function estimates for energy and periods of the most intense FFT peaks, NB! outputs(x) can be ~=1, where x defines correction factor for kernel bandwidth, <1 decreases smoothing, >1 increases smoothing;
- save all intense FFT frequencies (as defined by findpeak function) and corresponding periods and powers to .mat files;
- plot samples statistics (number of samples in dataset and distributions of sample lengths before zero-padding);
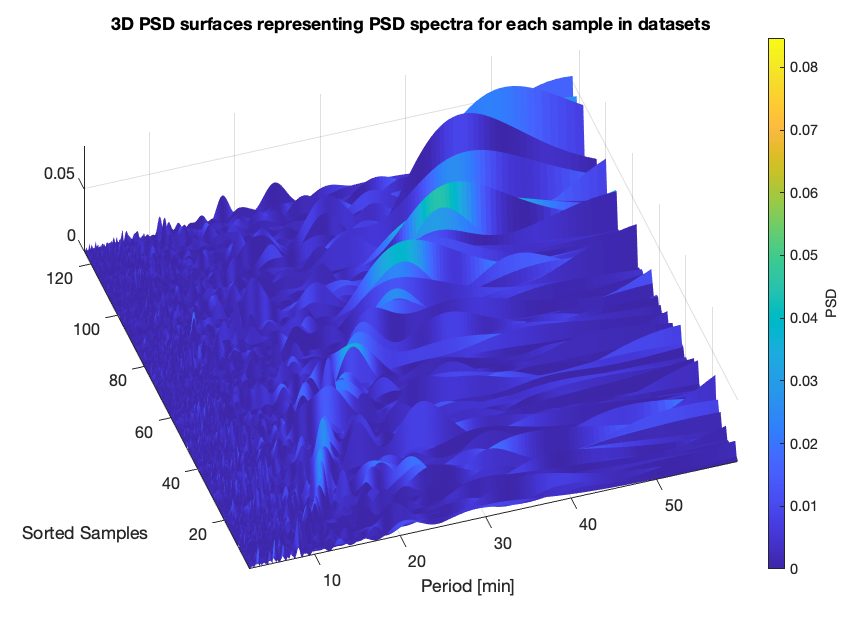
- 3D PSD surfaces representing PSD spectra for each sample in datasets;
- induvidual length curves filtered with low-pass FFT filter;
- time-frequency spectrograms (STFT) for each sample in datasets;
- Continuous Wavelet Transform (CWT) for each sample in datasets (requires wavelet toolbox).
- plot difference spectra for pairs(n0,n) of datasets where n0 is the dataset which is being subtructed, typically WT slow growth; put no to outputs vector
By Maria Mukhina for Kleckner Lab
24.02.2020
GNU GENERAL PUBLIC LICENSE v3