This repository is under construction. It has the objective to put together interesting materials about AQI. The notebook is a quick example on how to retrieve AQI Singapore and to manipulate (just a bit) the JSON response.
Disability-adjusted life years or 'DALYs' have been used in this report to quantify the burden of asthma. The DALY describes the number of years of healthy life lost due to disability or premature death. One DALY represents one lost year of healthy life.
Quantifying the impact of asthma in terms of its burden, measured as DALYs, allows relative valuation of the impact of this disease-both overall and in subgroups of society-relative to other diseases. This has important consequences for health decision-making and planning processes. This report provides an indication of opportunities for health gain and will help guide the formation of health policy in relation to asthma. For example, interventions to reduce the Indigenous health gap in chronic respiratory disease burden and to improve the uptake of the key elements of effective asthma management-namely, a written asthma action plan and regular use of medications that control the disease and prevent exacerbations-represent two strategies likely to lead to reduced burden of disease attributable to asthma.
Challenges faced by open data platforms:
- Make accurate and real-time transport data available to the public
- Make this data available in an easy-to-use format
- Create a sustainable and collaborative data environment that drives innovation
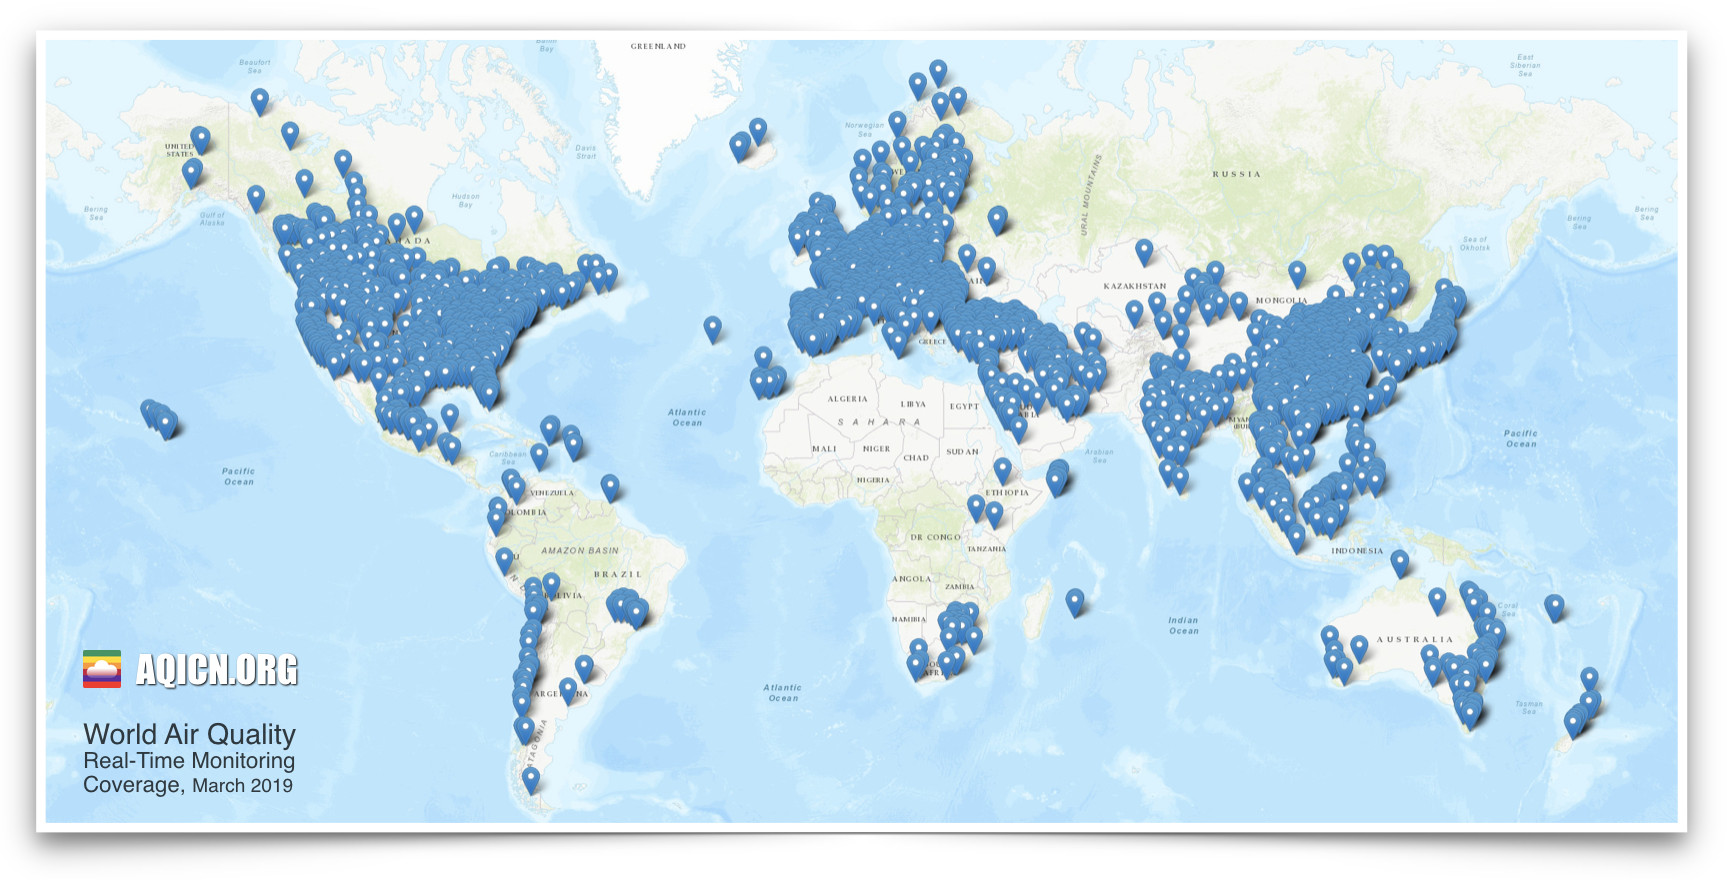
The World Air Quality Project: https://aqicn.org
In March 2020, real-time Air Quality information is available for than 12,000 stations in 1000 major cities from 100 countries, thanks to the huge effort from the world EPAs (Environmental Protection Agencies).
GET Method to retrieve JSON Data from the platform:
https://api.waqi.info/feed/YOUR_CITY/?token=TOKEN_KEY
You need to register in order to get a token: https://aqicn.org/data-platform/token/
There are currently more than 30,000 known air quality monitoring stations in the world, out of which more than 12,000 are published on the World Air Quality Index project. In order to keep a high level on consistency, only stations with particulate matter (PM2.5/PM10) readings are published. The AQI standard for every single published station is based on the US EPA Instant-Cast standard.
Example of JSON data received from: api.waqi.info
{
    "status": "ok",
    "data": {
        "aqi": 11, "idx": 12417,
        "attributions": [ {"url": "https://www.environment.nsw.gov.au/", "name": "Office of Environment and Heritage - NSW", "logo": "Australia-NSW.png"}, {"url": "https://waqi.info/", "name": "World Air Quality Index Project"}],
        "city": { "geo": [ -33.872468, 151.213337 ],
            "name": "Cook And Phillip Sydney East",
            "url": "https://aqicn.org/city/australia/nsw/cook-and-phillip/sydney-east"
        },
        "dominentpol": "neph",
        "iaqi": {
            "co": { "v": 1.2 },
            "h": { "v": 64.3 },
            "neph": { "v": 11 },
            "no2": { "v": 22.3 },
            "o3": { "v": 3.2 },
            "p": { "v": 1009.3 },
            "pm10": { "v": 8 },
            "pm25": { "v": 10 },
            "so2": { "v": 1.5 },
            "t": { "v": 18.7 },
            "w": { "v": 0.6 },
            "wg": { "v": 4.6 }
        },
        "time": { "s": "2020-04-20 22:00:00", "tz": "+10:00", "v": 1587420000},
        "debug": { "sync": "2020-04-20T21:29:29+09:00"}}
}Most of the countries also maintain their own public open data platforms.
We will have a look at Singapore's data, available at: https://api.data.gov.sg
The API call doesn't need any token, you can directly call the public API on your app with the GET Method:
https://api.data.gov.sg/v1/environment/psi/?date=2020-01-01
The result message will also be a JSON format in two sections: The first section is the Stations coordinates: (note an additional region has been created to generate a national mean)
{
    "region_metadata": [
        {"name": "west",
            "label_location": { "latitude": 1.35735, "longitude": 103.7 }
        },
        {"name": "national",
            "label_location": { "latitude": 0, "longitude": 0 }
        },
        {"name": "east",
            "label_location": { "latitude": 1.35735, "longitude": 103.94 }
        },
        {"name": "central",
            "label_location": { "latitude": 1.35735, "longitude": 103.82 }
        },
        {"name": "south",
            "label_location": { "latitude": 1.29587, "longitude": 103.82 }
        },
        {"name": "north",
            "label_location": { "latitude": 1.41803, "longitude": 103.82 }
        }],
Followed by:
"items": [
        {
            "timestamp": "2020-01-01T01:00:00+08:00",
            "update_timestamp": "2020-01-01T01:08:52+08:00",
            "readings": {
                "o3_sub_index": {
                    "west": 10,
                    "national": 16,
                    "east": 12,
                    "central": 16,
                    "south": 12,
                    "north": 15
                },
                "pm10_twenty_four_hourly": {
                    "west": 21,
                    "national": 22,
                    "east": 22,
                    "central": 18,
                    "south": 22,
                    "north": 18
                },
Other readings following are: pm10_sub_index, co_sub_index, pm25_twenty_four_hourly, so2_sub_index, co_eight_hour_max, no2_one_hour_max, so2_twenty_four_hourly, pm25_sub_index, psi_twenty_four_hourly, o3_eight_hour_max. Items are for hourly timestamp:
            "timestamp": "2020-01-01T02:00:00+08:00",
            "update_timestamp": "2020-01-01T02:08:52+08:00",
"readings": Air Quality Data can retrieved as Station Data (JSON, CSV, XLS TABLES) or as maps (GeoJSON, SHP). We will investigate different types.
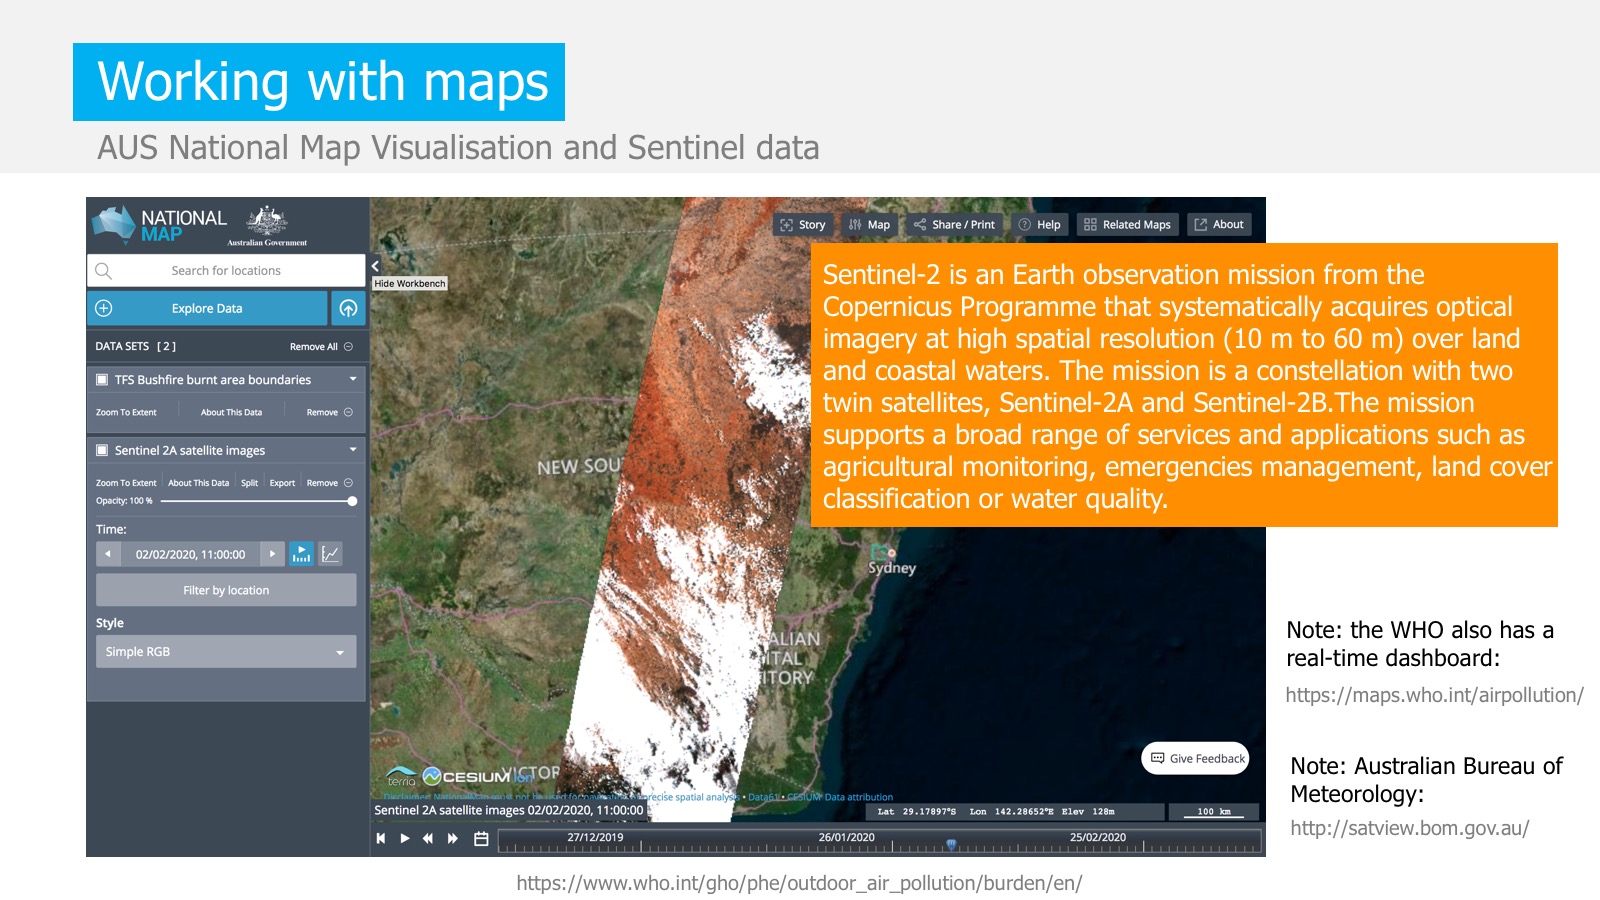
- Sentinel 5P OFFL NO2
Sentinel-5 Precursor (Sentinel-5P) is an Earth observation satellite developed by ESA as part of the Copernicus Programme. The Copernicus Programme is dedicated to monitoring air pollution and Sentinel 5P Precursor is its first mission. It consists of an instrument called Tropomi (TROPOspheric Monitoring Instrument) which is a spectrometer to monitor ozone, methane, formaldehyde, aerosol, carbon monoxide, NO2 and SO2 in the atmosphere.
The OFFL/NO2 is a dataset that provides offline high-resolution imagery of NO2 concentrations
How to use maps: QGIS https://www.qgis.org/en/site/
QGIS is a free and open-source cross-platform desktop geographic information system (GIS) application that supports viewing, editing, and analysis of geospatial data.
Get started: https://www.qgis.org/en/site/forusers/index.html
- Global Power Plant Database by World Resources Institute(WRI)
The Global Power plant database is a fully open-sourced(licensed under CC-BY 4.0.) and a comprehensive database that includes details of powerplants around the world. The database covers approximately 30,000 power plants from 164 countries and includes both thermal and renewable power plants.
How to use stations data:
https://github.com/antoinedme/aqi-data/blob/master/notebooks/read-singapore-data.ipynb
- Global Forecast System 384-Hour Predicted Atmosphere Data
Global Forecast System(GFS) is a model that forecasts weather.The GFS is a coupled model, composed of an atmosphere model, an ocean model, a land/soil model, and a sea ice model which work together to provide an accurate picture of weather conditions
- GLDAS-2.1: Global Land Data Assimilation System
This dataset provided by NASA ingest satellite- and ground-based observational data products, using advanced land surface modeling and data assimilation techniques, in order to generate optimal fields of land surface states and fluxes (Rodell et al., 2004a)
Read the article: https://www.forbes.com/sites/tracybrower/2020/01/05/how-to-jump-start-your-innovation-8-ways-to-be-more-innovative/#237ed60a3a12
Tracy Brower