A set of scripts to calculate ratings for teams, based on either point differential or modified Elo rating in addition to strength of schedule, and then use those ratings to determine playoff odds over a given season.
info_table - generates a snapshot of a season (pythagorean wins, Strength-of-Schedule adjusted net rating, away record, home record, and overall record)
Pythagorean Win Expectations, Est. SRS, and Records
Based on Games Played Between: Oct 01 2018 and May 01 2019
======  ==============  ==========  =============  =============  ================
Team    Pythag. Wins    Est. SRS    Away Record    Home Record    Overall Record
======  ==============  ==========  =============  =============  ================
MIL     64              4.409       27-14          33-8           60-22
GSW     60              3.61        27-14          30-11          57-25
TOR     58              3.461       26-15          32-9           58-24
HOU     55              2.744       22-19          31-10          53-29
POR     53              2.674       21-20          32-9           53-29
DEN     53              2.536       20-21          34-7           54-28
UTA     56              2.498       21-20          29-12          50-32
OKC     51              1.904       22-19          27-14          49-33
PHI     49              1.55        20-21          31-10          51-31
BOS     54              1.486       21-20          28-13          49-33
LAC     44              1.413       22-19          26-15          48-34
IND     51              1.255       19-22          29-12          48-34
SAS     45              1.174       16-25          31-10          47-35
ORL     43              -0.085      17-24          25-16          42-40
SAC     38              -0.152      15-26          24-17          39-43
CHA     38              -0.307      14-27          25-16          39-43
DET     40              -0.31       15-26          26-15          41-41
BKN     41              -0.436      19-22          23-18          42-40
MIA     40              -0.541      20-21          19-22          39-43
LAL     37              -0.582      16-25          22-19          38-44
MIN     37              -0.726      11-30          25-16          36-46
MEM     33              -1.064      12-29          21-20          33-49
NOP     37              -1.202      14-27          19-22          33-49
DAL     37              -1.433      9-32           24-17          33-49
WAS     33              -2.012      10-31          22-19          32-50
ATL     24              -3.192      11-30          17-24          28-54
CHI     18              -3.992      13-28          9-32           22-60
PHX     17              -4.462      7-34           12-29          19-63
CLE     16              -5.046      6-35           13-28          19-63
NYK     16              -5.174      8-33           9-32           17-65
======  ==============  ==========  =============  =============  ================
prediction_table - generates a table of playoff odds (now Elo based, see below)
Playoff odds for the 2020 season as of Dec 01 2019
============  ===========  ===========  ===========
Conference    Team         Avg. Wins    Playoff %
============  ===========  ===========  ===========
E             MIL          54.8         100.0%
E             TOR          52.6         100.0%
E             IND          49.2         100.0%
E             BOS          43.9         100.0%
E             PHI          42.6         99.9%
E             MIA          40.1         99.8%
E             ORL          34.2         89.1%
E             BKN/NJN      31.4         67.5%
E             WAS          28           29.9%
E             DET          26.3         13.7%
E             CHA          20.9         0.1%
E             CHI          17.6         0.0%
E             CLE          17.5         0.0%
E             ATL          16.5         0.0%
E             NYK          15.5         0.0%
W             HOU          53.1         100.0%
W             LAC          50.8         100.0%
W             DEN          50.4         100.0%
W             UTA          48           100.0%
W             LAL          43           99.1%
W             DAL          42.3         98.1%
W             OKC/SEA      42.2         98.4%
W             SAS          37.2         79.0%
W             MIN          30.9         7.0%
W             POR          30.6         7.6%
W             MEM/VAN      30           5.5%
W             GSW          29.9         2.7%
W             NOP/NOH/CHA  27.8         1.5%
W             PHX          26.5         1.0%
W             SAC          25           0.1%
============  ===========  ===========  ===========
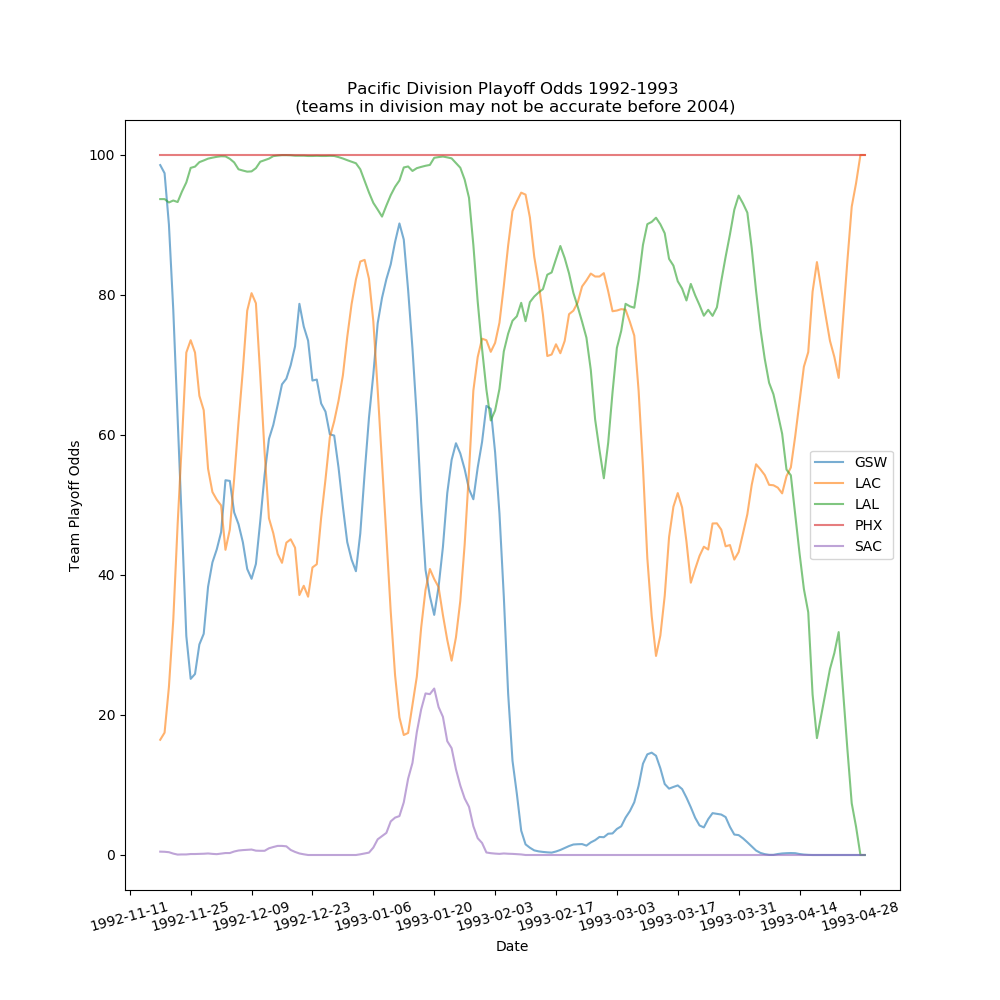
plot_season_odds - creates a graph of playoff odds for teams in one division in one season
update_nba_api - obtains data (for now, just end scores) from the undocumented stats.nba.com api.
Use "git clone..." or download a zip.
Monte Carlo simulation extension written in C++ requires g++ compilation using the build script (python/cython_mcss/ext_build.sh) and associated dependencies, see below.
Python requirements:
the nba_py library (only for update_nba_api)
peewee (version 3.11+)
numpy, scipy, and cython
C++ requirements for compiling Monte Carlo cython extension (on Linux):
libarmadillo-dev
libsqlite3-dev
On Windows in order to build the Monte Carlo simulation extension, you will require:
Microsoft Visual C++ as described in the .vsconfig file (tested with VC.141.x86.64)
Armadillo libraries have been included for this purpose (see below Attribution)
Note that the program runs much slower under Windows:
info_table: about 3 seconds on Linux, about 9 seconds on Windows
prediction_table: about 0.7 seconds on Linux, about 2.1 seconds on Windows
plot_season_odds: about 1.2 on Linux, about 4.2 seconds on Windows
Windows users with access to WSL or WSL2 should consider running the program under those virtualization options as it will most likely run much faster.
I've decided to replace the Simple Rating System based projections with projections based on a calculated Elo rating. The following is a brief summary of how this model was created. It is very similar to, and inspired by, the model used by Flat Track Stats for roller derby.
In order to do so, I first obtained boxscore data from the past 30 seasons in order to calculate the "difference over sum" value distribution.
Difference over sum is defined as (home_pts-away_pts)/(home_pts+away_pts)
This metric is based on points scored and points allowed and therefore rewards teams for offense and defense. Difference-over-sum has two main advantages over the Simple Rating System:
- does not require solving a system of equations, games can be taken as they happen
- provides a more mathematically sound way of dealing with blowouts
The first point is highly pertinent if, say, there might be some reason games get cancelled/not as many games as you need are available.
Once a distribution was fit, the coefficients were used in a formula that predicts the difference-over-sum value. The difference between the predicted difference-over-sum value and actual difference-over-sum value is then multiplied by a factor in order to adjust the rating of each team.
Manual calibration and testing were used to obtain appropriate initial ratings and K factor. Once the ratings were deemed to be stable and reflective of reality (both on a single-season and historical basis), a win expectancy model was created, similar to the one here similar to the one here, using the known home team advantage in the NBA (60%) and an assumption on what the odds of the worst team beating the best team is/what that difference can be expected to be in Elo points (approximately 450 and 5%).
The original SRS based model remains available for legacy reasons/comparison.
- Playoff tiebreakers.
This project incorporates source from the Armadillo C++ Linear Algebra Library. As such, the attributions of Armadillo will be included in this project in accordance with their wishes:
Copyright 2008-2018 Conrad Sanderson (http://conradsanderson.id.au)
Copyright 2008-2016 National ICT Australia (NICTA)
Copyright 2017-2018 Arroyo Consortium
Copyright 2017-2018 Data61, CSIRO
This product includes software developed by Conrad Sanderson (http://conradsanderson.id.au)
This product includes software developed at National ICT Australia (NICTA)
This product includes software developed at Arroyo Consortium
This product includes software developed at Data61, CSIRO