![]()
This package is inspired by matplotlib-label-lines
It adds automatic label positioning by preventing label bounding boxes from overlapping other lines and each other.
Just do:
pip install matplotlib-inline-labelsimport numpy as np
from matplotlib import pyplot as plt
from scipy.stats import chi2, loglaplace
from inline_labels import add_inline_labels
X = np.linspace(0, 1, 500)
A = [1, 2, 5, 10, 20]
funcs = [np.arctan, np.sin, loglaplace(4).pdf, chi2(5).pdf]
fig, axes = plt.subplots(ncols=2, nrows=3, constrained_layout=True, figsize=(8, 8))
axes = axes.flatten()
for a in A:
axes[0].plot(X, np.arctan(a * X), label=f"Line {a}")
add_inline_labels(axes[0], with_overall_progress=True, fontsize="large")
for a in A:
axes[1].plot(X, np.sin(a * X), label=f"Line {a}")
axes[2].plot(X, loglaplace(4).pdf(a * X), label=f"Line {a}")
axes[3].plot(X, chi2(5).pdf(a * X), label=f"Line {a}")
axes[4].semilogx(X, np.arctan(5 * a * X), label=str(a))
axes[5].semilogx(X, chi2(5).pdf(a * X), label=str(a))
add_inline_labels(axes[1], with_overall_progress=True, fontsize="x-small")
add_inline_labels(axes[2], with_overall_progress=True, fontsize="medium")
add_inline_labels(axes[3], with_overall_progress=True, fontsize="medium")
add_inline_labels(axes[4], with_overall_progress=True, fontsize="small")
add_inline_labels(axes[5], with_overall_progress=True, fontsize="small")
fig.show()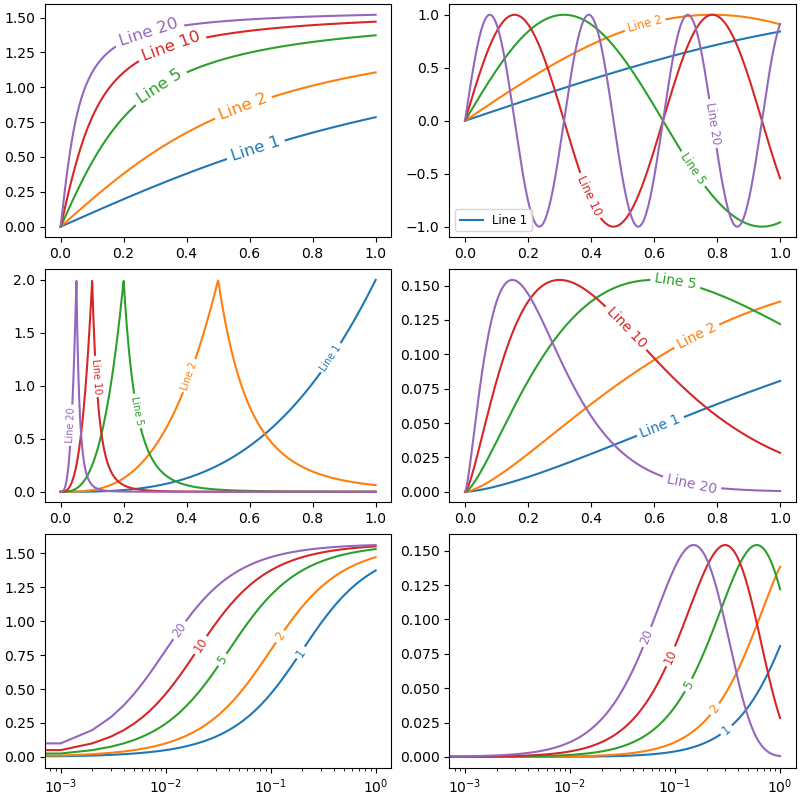
If something goes wrong or the automatic placement could be enhanced, a visual debug is available:
fig, ax = plt.subplots()

for a in A:
    ax.semilogx(X, chi2(5).pdf(a * X), label=f"Line {a}")
ax.set_ylim(top=0.12)
fig_debug = add_inline_labels(ax, ppf=1.5, with_perlabel_progress=True, debug=True)

fig_debug.show()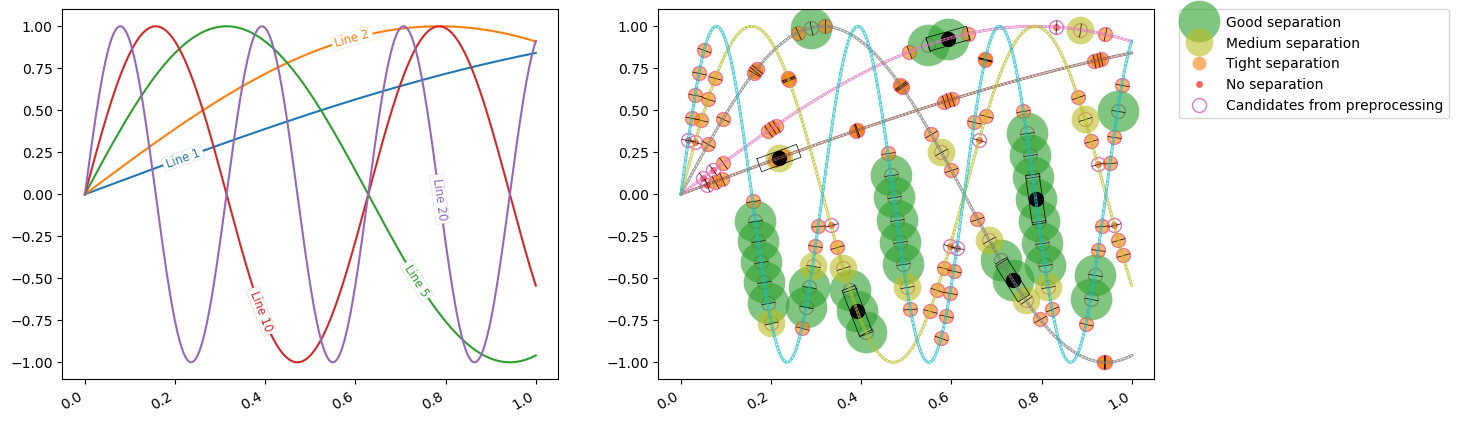
- Handle the case of axis lims or scale modification after adding inline labels
- Create an option to search label's position keeping the label's bounding box sides intersecting the curve in their centers
- Avoid Line2D labels to overlap non Line2D objects -> Needs to build geometries for other objects