
![]()
The goal of {skyphone} is to create an audio version of a GitHub Skyline in R.
Skyline is a novelty webservice from GitHub. You input a username and can ‘view a 3D model of your GitHub contribution graph.’ It looks a bit like a city skyline, hence the name.
{skyphone} is an exploratory package that fetches the contributions data from the Skyline API and puts it in a nice, tidy table that you can sonify (i.e. convert to an audio signal) or plot. You can read more in a blog post.
Note: The GitHub Skyline API—on which {skyphone} depends—stopped responding (i.e. it 404s) soon after the package was created. I may fix {skyphone} in future to work via {gh} instead; feel free to contribute.
You can install the {skyphone} package from GitHub:
remotes::install_github("matt-dray/skyphone")This assumes you’ve already installed {remotes} from CRAN with
install.packages("remotes")
The sky_get() function fetches from the Skyline API a named user’s
(open) contributions for a given year. Here’s what it looks like to
fetch my own contributions for 2020:
library(skyphone)
md <- sky_get("matt-dray", 2020)
md
#> # A tibble: 366 x 6
#> user year week day date count
#> <chr> <int> <int> <int> <date> <int>
#> 1 matt-dray 2020 1 1 2020-01-01 5
#> 2 matt-dray 2020 1 2 2020-01-02 5
#> 3 matt-dray 2020 1 3 2020-01-03 8
#> 4 matt-dray 2020 1 4 2020-01-04 3
#> 5 matt-dray 2020 2 5 2020-01-05 0
#> 6 matt-dray 2020 2 6 2020-01-06 7
#> 7 matt-dray 2020 2 7 2020-01-07 10
#> 8 matt-dray 2020 2 8 2020-01-08 2
#> 9 matt-dray 2020 2 9 2020-01-09 6
#> 10 matt-dray 2020 2 10 2020-01-10 0
#> # … with 356 more rows
You can hear contributions over time by passing the output from
sky_get() to sky_sonify(). This function uses the {sonify} package
to convert the data to audio format, where peaks are higher pitched.
sky_sonify(md, play = FALSE, out_dir = NULL)#>
#> WaveMC Object
#> Number of Samples: 220500
#> Duration (seconds): 5
#> Samplingrate (Hertz): 44100
#> Number of channels: 2
#> PCM (integer format): TRUE
#> Bit (8/16/24/32/64): 16
You’ll hear the output from your speakers if you set play = TRUE
and/or save the audio file as a .wav to the folder provided by
out_dir.
🔈 Click here to listen to the sonified output from this example.
I’ve also included a simple, opinionated plotting function called
sky_plot, which gives you a 2D representation of your ‘skyline’.
p <- sky_plot(md)
p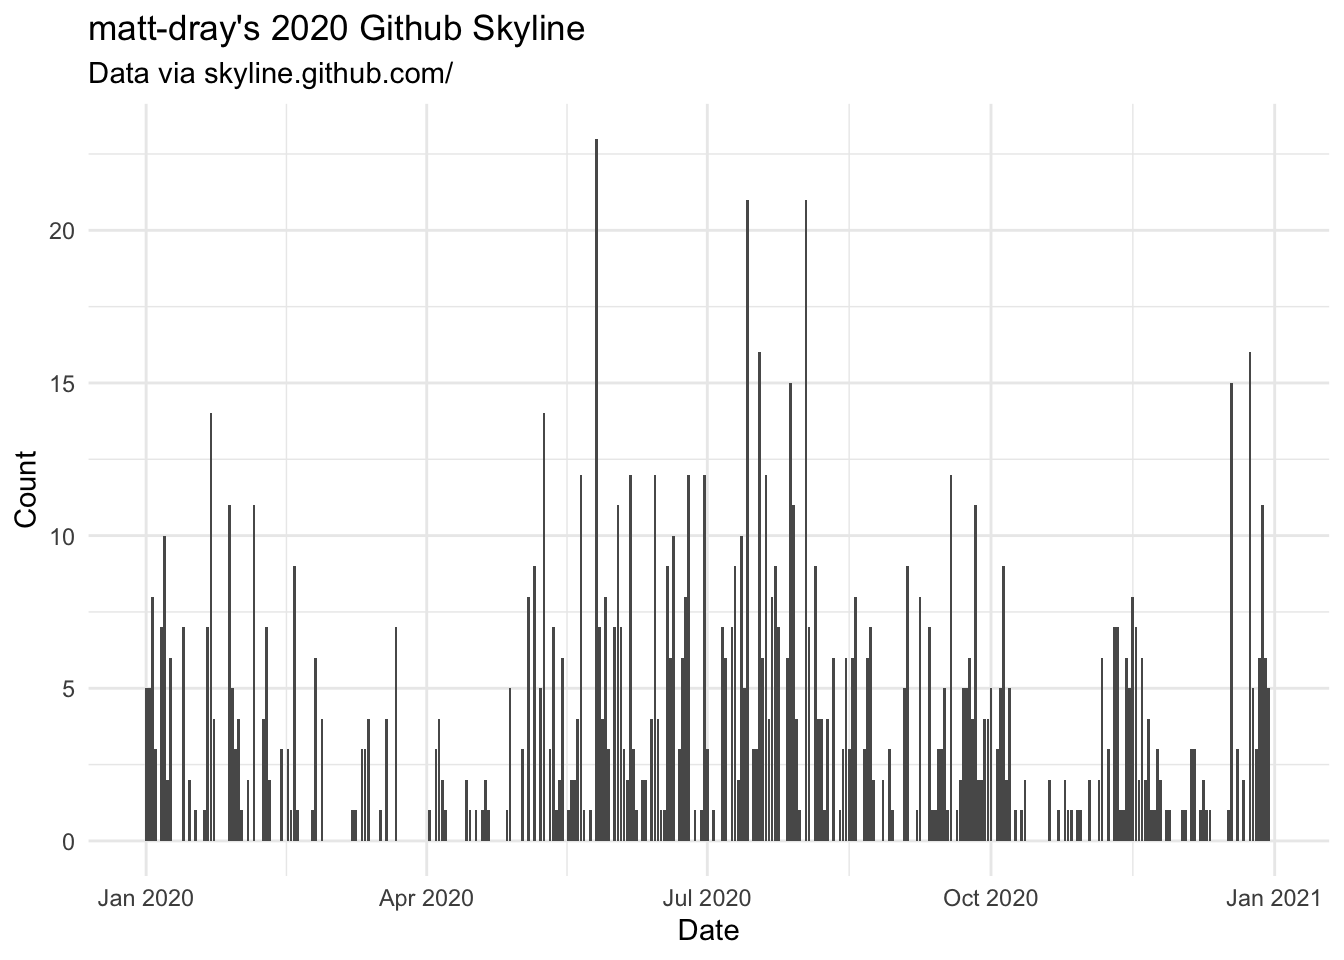
To GitHub, obviously. To Matt Kerlogue for the nerdsnipe. To Den Delimarsky for writing about the Skyline API.
You can read GitHub’s terms and privacy statement for their service.
Please note that the {skyphone} project is released with a Contributor Code of Conduct. By contributing to this project, you agree to abide by its terms.