Skip to content

maxnoe/python-plotting

Folders and files

NameName
Last commit message
Last commit date

Latest commit


History

36 Commits


Repository files navigation

python-plotting

A nice little collection of some matplotlib plots I created.

Function that creates ticklabels with siunitx

As german i want to have the , as decimal marker and i want to use text.usetex: true. Using the locale for matplotlib leads to disgusting spacing. To solve this problem i'm using siunitx to typeset the ticklabels: Source code alt text

Animation of several eigen modes of a circular membrane

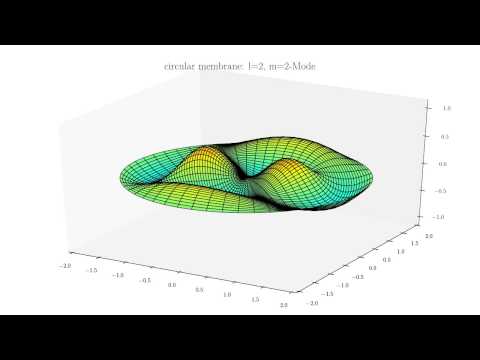
Source code Click on image for YouTube video:

Foo

function to create LaTeX-labels with multiples of Pi

Source code alt text

normed histograms with errorbars:

Source code alt text

add area of fill_between to legend:

Source code alt text

About

Ah nice little collection of some matplotlib features

Resources

License

Stars

Watchers

Forks

Releases

No releases published

Packages

No packages published

Languages